Paper Outlook — September 7-13, 2026

· 5 min read · Paper Feed

Paper Outlook — September 7-13, 2026

本周速览

  • 空间转录组学是本周的主线:既以方法学身份登场(心脏综述、新的细胞身份识别工具),也作为癌症与免疫学发现的核心引擎。
  • 多篇论文在做大规模图谱:跨 21 种癌症类型的 T 细胞多样性、25000 多份组织样本里衰老相关的熵模式,以及心房颤动的遗传驱动因素。
  • 多组学整合(RNA + 蛋白 + 染色质 + 空间)已经是严肃疾病研究——尤其是癌症和心脏生物学——的默认打法。
  • 一个反复出现的主题是微环境与上下文:细胞身份和肿瘤行为很大程度上取决于周围邻居,而不是只看细胞自己的分子谱。
  • 转化研究的味道越来越浓——衰老相关的熵、神经母细胞瘤的免疫逃逸、房颤风险基因——都指向潜在的临床生物标志物或治疗靶点。

Tissue-Level Transcriptomic Entropy Reveals Organ-Specific Aging Patterns and Predicts Cancer Progression.

这篇文章用「转录组熵」这个衡量基因活动无序程度的指标,在人和小鼠的多种组织里研究衰老。不同器官的衰老轨迹并不一样,而这个指标和细胞衰老、突变累积、癌症进展这些经典衰老标志对得很齐。作者认为,转录组熵有潜力作为生物学年龄和癌症风险的一个量化指标。
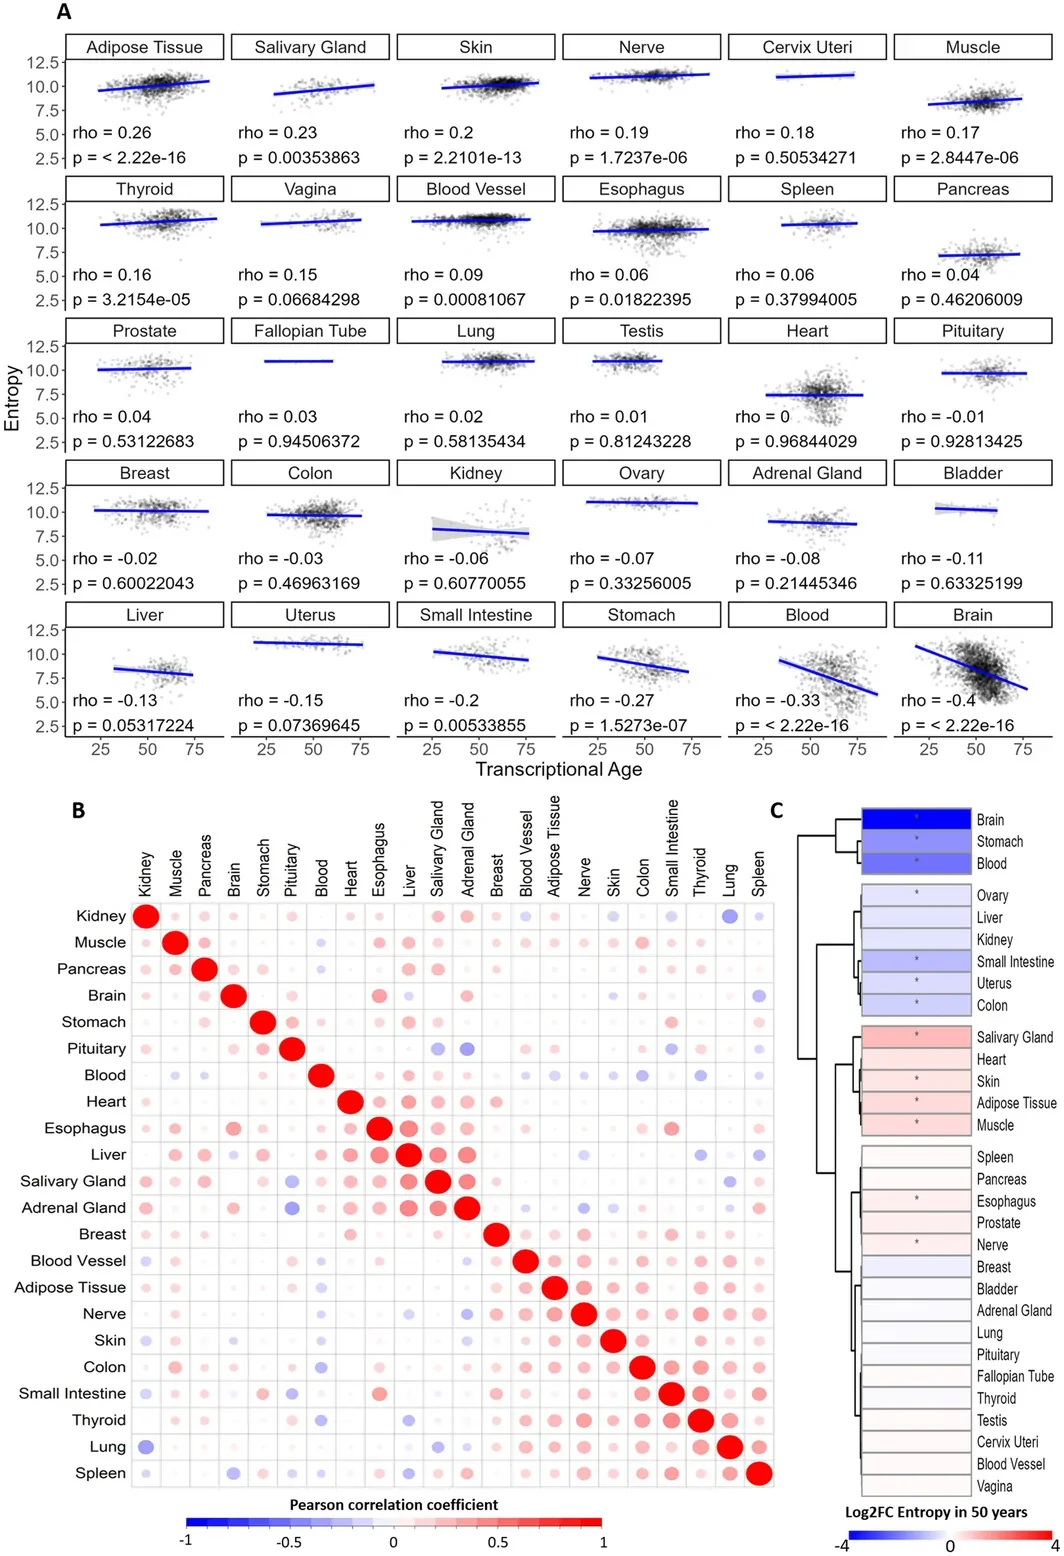
Transcriptomic entropy during human aging. (A) Pearson correlation and linear trend between entropy and transcriptional age in human tissues. (B) Correlogram of entropy values spanning different tissues from the same individual. (C) Heatmap of entropy variation with transcriptional age; results from the adjusted linear model. * p value < 0.05.

FIGURE 1,出自 Dos Santos GA 等, Aging cell (2026)。许可协议 CC BY。来源:10.1111/acel.70696。

Aging cell (2026) · 0 次引用

阅读原文 → https://doi.org/10.1111/acel.70696


Integrated Genomic and Proteomic Analysis Reveals T-B Lymphocyte Signatures in the MYCN Driven "Immune Desert" of Specific Neuroblastoma Subtypes.

这篇文章研究的是一类由 MYCN 驱动、极具侵袭性的儿童神经肿瘤为什么这么擅长躲避免疫监视。作者整合了几百例样本的多组学数据,把这些肿瘤的免疫微环境画得相当细致。文中锁定了几组特定的免疫特征和细胞互作模式,可能为新的免疫治疗策略提供抓手。
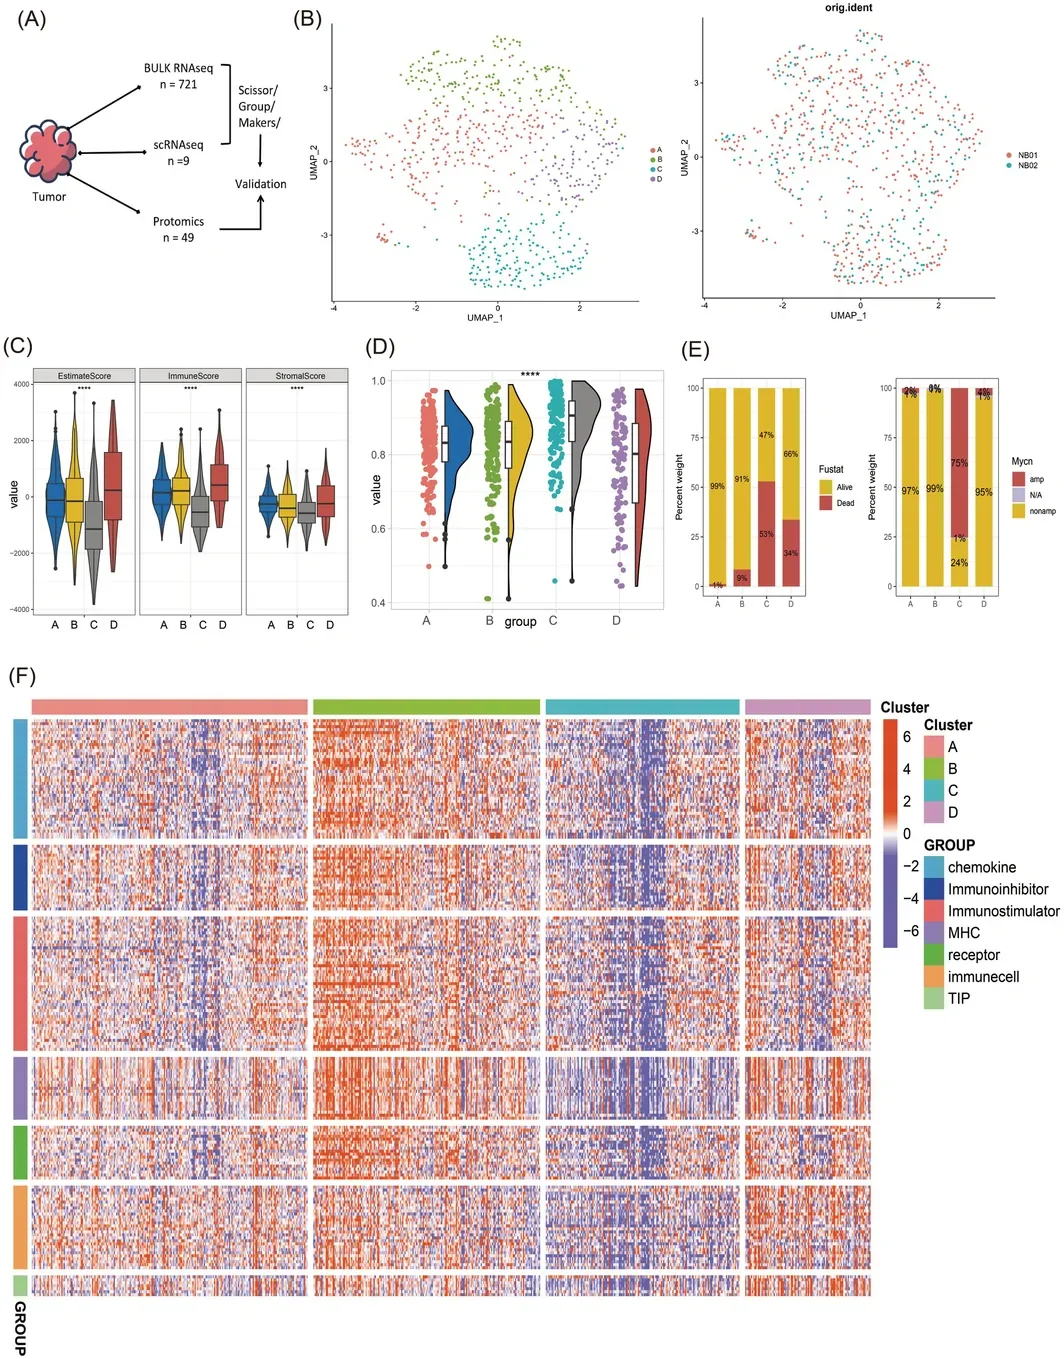
Identification and immune characterization of the MYCN‐driven “immune desert” subtype (Class C) in neuroblastoma. (A) Overview of the integrated multi‐omics cohorts. (B) UMAP plot of bulk RNA‐seq data from 721 samples defining four molecular subtypes (A–D). (C) Comparison of ESTIMATE algorithm‐derived scores (Immune, Stromal, ESTIMATE) and tumor purity across the four subtypes. (D) Violin plots comparing tumor purity between Class C and Non‐Class C (NOC) groups. (E) Enrichment of clinical features across the new subtypes. Stacked bar plots show the proportions of survival outcomes (Dead/Alive) and MYCN amplification status (amp, amplified; nonamp, non‐amplified) within each subtype (A–D). (F) Comprehensive immune landscape analysis across subtypes. Heatmaps display the relative enrichment scores, calculated using ssGSEA, for: 28 immune cell types (gene set from GSEA), activity of the 7‐step Cancer‐Immunity Cycle (gene set from TIP), and expression levels of immune‐related molecules including chemokines, MHC molecules, immunostimulators, immunosuppressors, and receptors (gene lists from TISIDB). Statistical significance: **** p < 0.0001. amp, amplified; NOC, Non‐Class C; nonamp, non‐amplified.

1,出自 Hu JJ 等, CNS neuroscience & therapeutics (2026)。许可协议 CC BY。来源:10.1002/cns.71054。

CNS neuroscience & therapeutics (2026) · 0 次引用

阅读原文 → https://doi.org/10.1002/cns.71054


Decoding cardiac homeostasis and injury: the evolving landscape of spatial transcriptomics

这篇综述盘点了空间转录组学如何重塑心血管研究——这门技术能在保留组织空间位置的前提下测量基因活性。文中梳理了不同的技术路线和分析方法,以及它们在心脏发育、稳态和疾病中带来的新发现。对于想进入这个领域的研究者来说,算是一张不错的路线图。
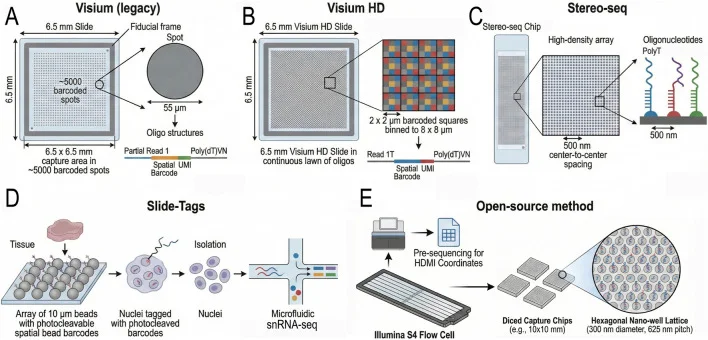
Overview of Sequencing-Based Spatial Transcriptomics (sST) Platforms. (A) The legacy Visium platform utilizes capture spots with a diameter of 55 µm. This resolution aggregates the transcriptomes of 2–10 cells, effectively obscuring cellular heterogeneity and necessitating computational deconvolution to infer cellular composition. (B) Visium HD employs 2 µm resolution bins to significantly improve spatial granularity, providing single-cell resolution across the whole transcriptome. (C) Stereo-seq utilizes DNA nanoball (DNB) technology on lithographically etched chips to achieve a spot size of 220 nm and a pitch of 500–715 nm. This nanoscale resolution enables the capture of transcripts with high spatial fidelity across large fields of view. (D) Slide-tags employs a strategy of spatial indexing where nuclei are tagged with photocleavable barcodes from an array of 10 µm beads prior to isolation. This method reconstructs spatial information computationally and is compatible with standard single-nucleus RNA sequencing workflows. (E) Open-source methods, such as Seq-Scope or Nova-ST, repurpose Illumina sequencing flow cells as ultra-high-density spatial arrays. By performing solid-phase amplification of randomly barcoded oligonucleotides directly on the flow cell surface, these methods generate RNA-capturing clusters spaced approximately 0.5 µm apart.

FIGURE 1,出自 Anis Hanna, Frontiers in Cell and Developmental Biology (2026)。许可协议 CC BY。来源:10.3389/fcell.2026.1772507。

Frontiers in Cell and Developmental Biology (2026) · 0 次引用

阅读原文 → https://doi.org/10.3389/fcell.2026.1772507


Pan-cancer single-cell landscape of tumor-infiltrating T cells

这是一项地标式的工作,作者在 21 种癌症类型、300 多例患者里,用单细胞测序搭起了一份相当完整的肿瘤浸润 T 细胞目录。研究识别出多种 T 细胞亚型,并梳理了它们各自的功能角色,包括部分细胞如何走向功能耗竭。这张图谱为理解肿瘤免疫和设计免疫治疗方案提供了一个靠谱的参考基准。
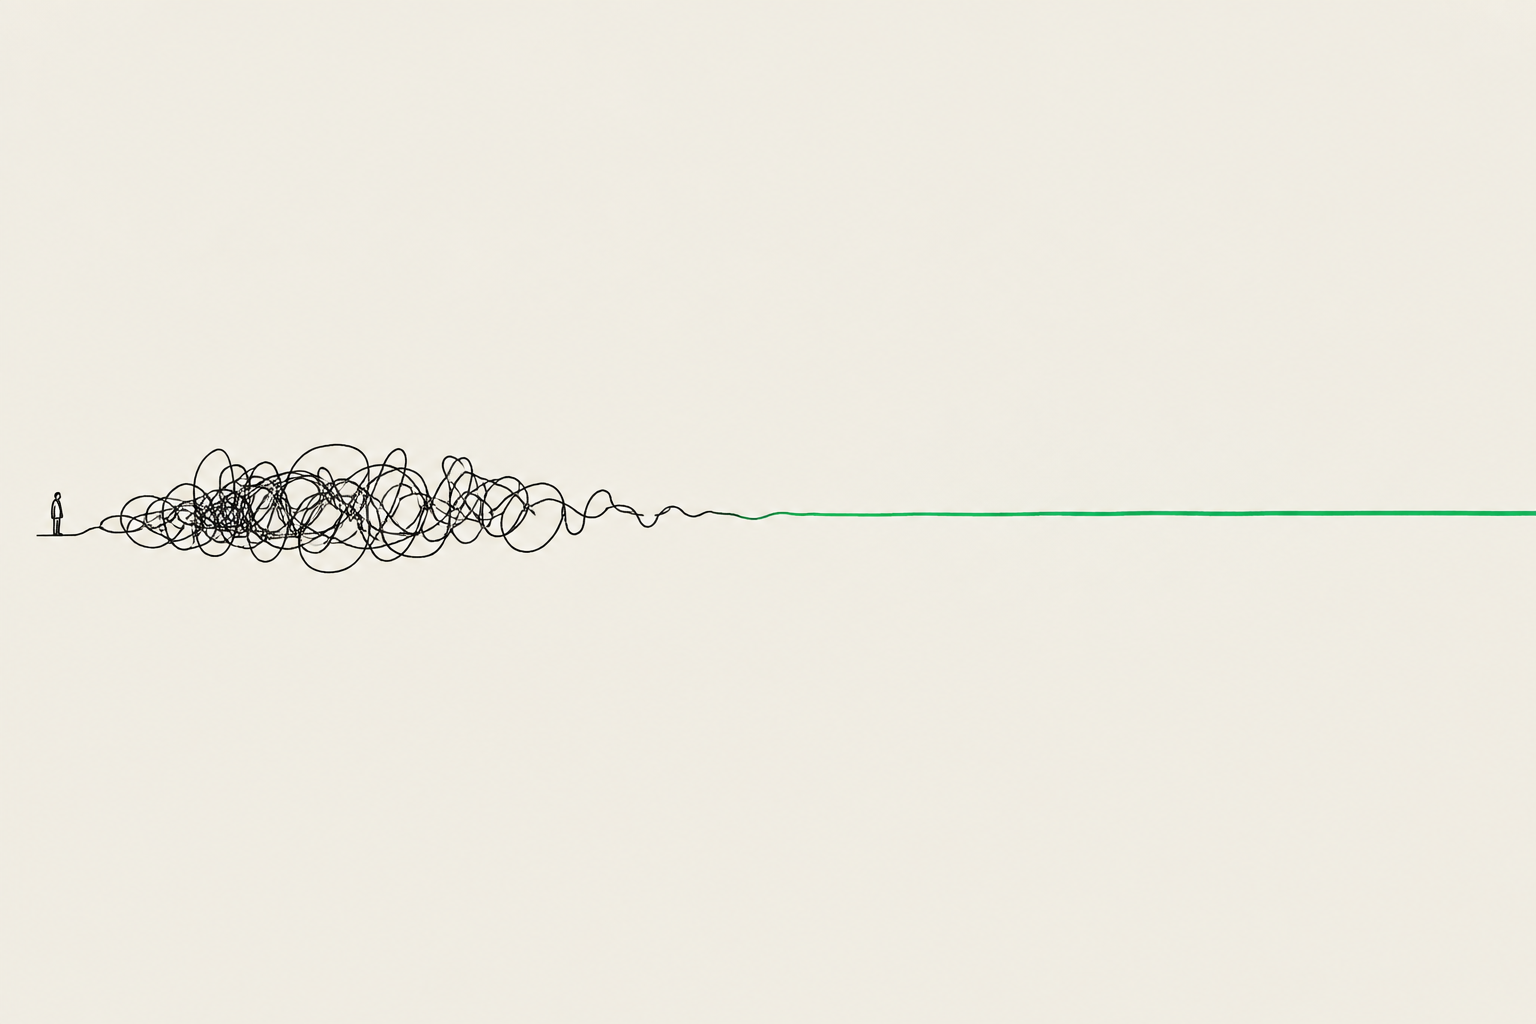
概念插图:Pan-cancer single-cell landscape of tumor-infiltrating T cells

Science (2021) · 1187 次引用

阅读原文 → https://doi.org/10.1126/science.abe6474


Atrial fibrillation variant-to-gene prioritization through cross-ancestry eQTL and single-nucleus multiomic analyses

心律疾病研究里一个绕不开的问题:和房颤相关的遗传变异位点,到底影响了哪些基因?这篇文章把跨祖源的 eQTL 数据与单核多组学(基因表达 + 染色质可及性等)结合起来,在九个疾病相关区间里把候选基因的范围收得更紧。这套分析框架有助于把遗传发现和心脏里的具体生物学机制挂上钩。
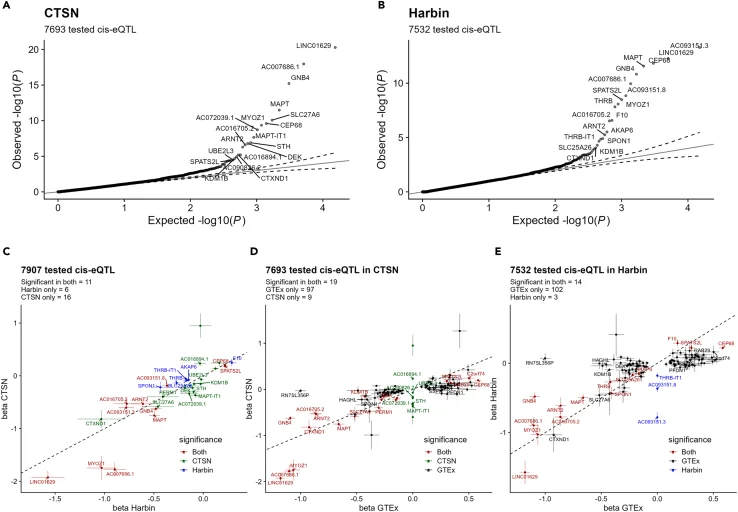
Expression quantitative trait locus (eQTL) mapping in human atrial tissue using RNA-sequencing (A and B) Quantile-quantile (QQ) plots of cis -eQTL –log10 ( p -values) for 150 sentinel atrial fibrillation (AF) SNPs and nearby genes (<1 Mb) in the (A) CTSN and (B) Harbin datasets. Dotted lines represent the 95% confidence interval of randomly generated normally distributed p -values. (C-E) Scatterplots comparing the eQTLs betas and their standard deviations from left atrial appendages (CTSN and Harbin) and right atrial appendages (Genotype-Tissue Expression; GTEx). (C) CTSN vs. Harbin, (D) CTSN vs. GTEx, (E) Harbin vs. GTEx. We attributed the value 0 to the eQTL if it was not tested in that cohort. (C–E) Colors indicate in which dataset(s) the eQTL is significant. eQTLs that were not significant in either of the paired cohorts are not shown for clarity. We added gene labels for the 20 most significant eQTLs in each cohort. Dotted lines represent x = y coordinates.

Figure 1,出自 F. Leblanc 等, iScience (2024)。许可协议 CC BY-NC-ND。来源:10.1016/j.isci.2024.110660。

iScience (2024) · 9 次引用

阅读原文 → https://doi.org/10.1016/j.isci.2024.110660


Microenvironment-aware spatial modeling for accurate inference of cell identity

这篇提出了一种新的计算方法,改进空间组学数据里细胞类型的判定。传统做法往往只看单个细胞的分子谱,忽略了邻近细胞对身份的塑造,新框架把周围邻居的信息也纳了进来。结果是细胞类型标注更准,对局部组织上下文塑造的细胞状态捕捉也更完整。

概念插图:Microenvironment-aware spatial modeling for accurate inference of cell identity

Nucleic Acids Research (2026) · 0 次引用

阅读原文 → https://doi.org/10.1093/nar/gkaf1477


快速链接

论文 期刊 / 年份 链接
Tissue-Level Transcriptomic Entropy Reveals Organ-Specific Aging Patterns and Predicts Cancer Progression. Aging cell (2026) 阅读 →
Integrated Genomic and Proteomic Analysis Reveals T-B Lymphocyte Signatures in the MYCN Driven "Immune Desert" of Specific Neuroblastoma Subtypes. CNS neuroscience & therapeutics (2026) 阅读 →
Decoding cardiac homeostasis and injury: the evolving landscape of spatial transcriptomics Frontiers in Cell and Developmental Biology (2026) 阅读 →
Pan-cancer single-cell landscape of tumor-infiltrating T cells Science (2021) 阅读 →
Atrial fibrillation variant-to-gene prioritization through cross-ancestry eQTL and single-nucleus multiomic analyses iScience (2024) 阅读 →
Microenvironment-aware spatial modeling for accurate inference of cell identity Nucleic Acids Research (2026) 阅读 →

Cancer Genomics Oncology Tumor Spatial Transcriptomics Spatial Omics Single-Cell Transcriptomics