Paper Outlook — September 7-13, 2026

· 5 min read · Paper Feed

Paper Outlook — September 7-13, 2026

TL;DR

  • Spatial transcriptomics is the center of attention this week — both as a method (a heart-focused review, a new cell-identity tool) and as a discovery engine in cancer immunology.
  • Several papers push on large-scale atlases: T cell diversity across 21 cancer types, entropy patterns in 25,000+ tissue samples during aging, and genetic drivers of atrial fibrillation.
  • Multi-omics integration (RNA + protein + chromatin + spatial) is becoming the standard for serious disease studies, especially in cancer and heart biology.
  • A common thread is the microenvironment: cell identity and tumor behavior depend heavily on neighbors, not only on a cell's own molecular profile.
  • Translation is in the air — aging-related entropy, neuroblastoma immune evasion, and AF risk genes all point toward clinical biomarkers or therapeutic targets.

Tissue-Level Transcriptomic Entropy Reveals Organ-Specific Aging Patterns and Predicts Cancer Progression.
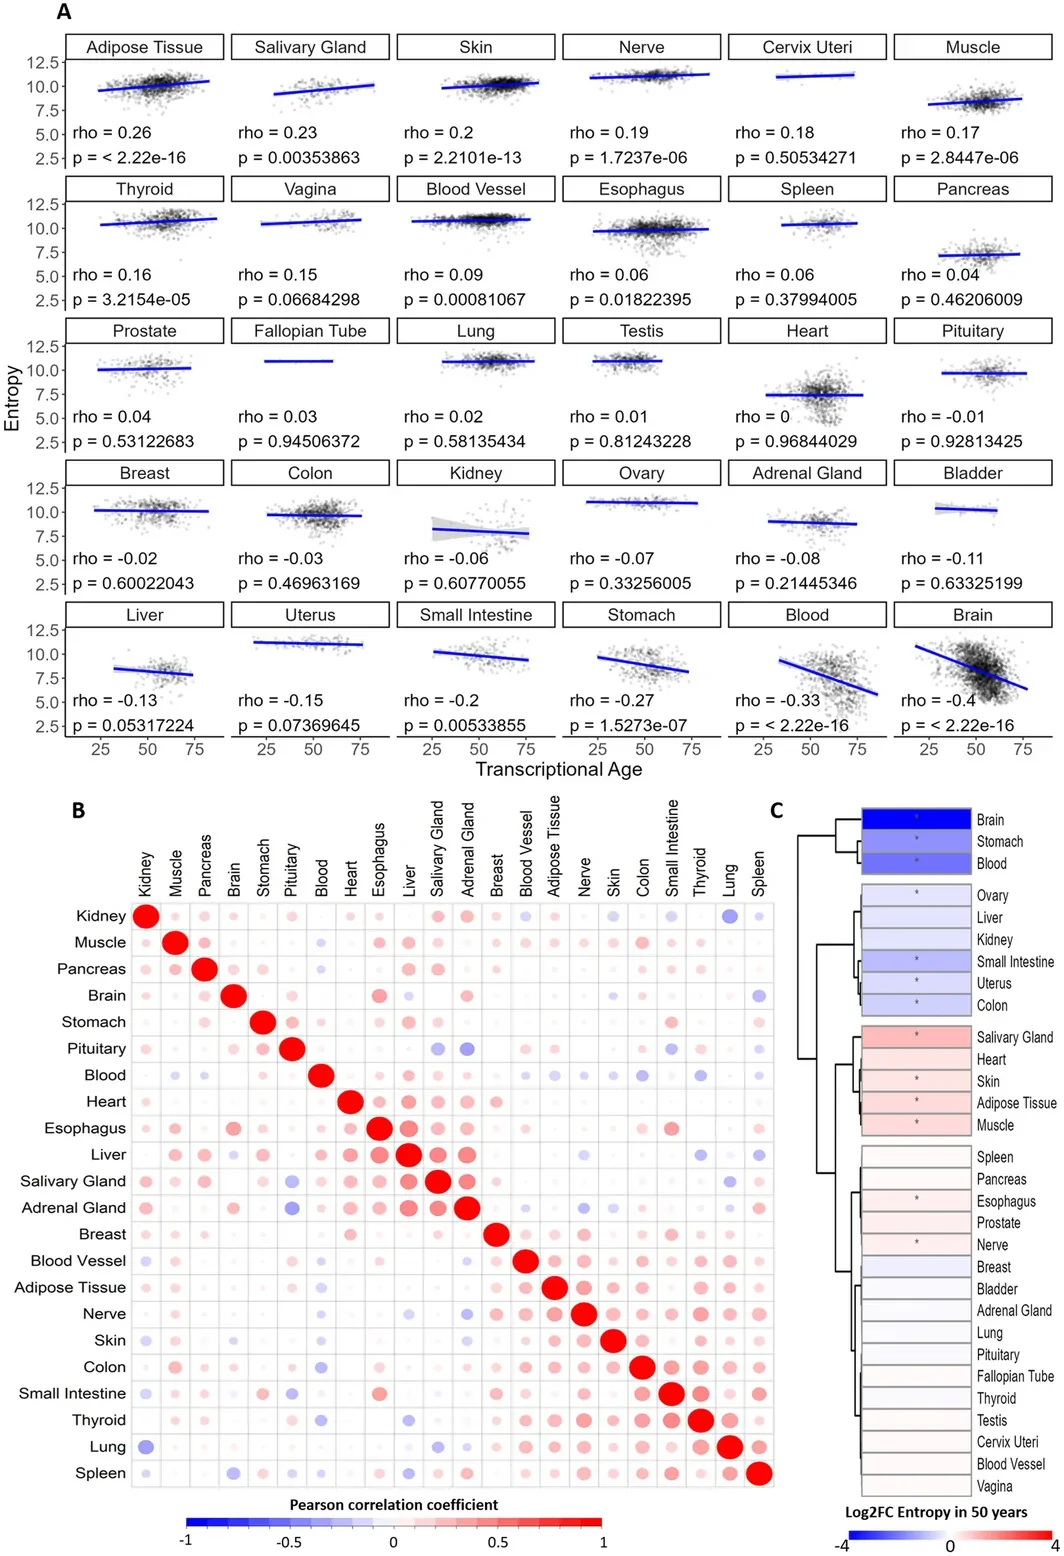
Transcriptomic entropy during human aging. (A) Pearson correlation and linear trend between entropy and transcriptional age in human tissues. (B) Correlogram of entropy values spanning different tissues from the same individual. (C) Heatmap of entropy variation with transcriptional age; results from the adjusted linear model. * p value < 0.05.

FIGURE 1 from Dos Santos GA et al., Aging cell (2026). Licensed CC BY. Source: 10.1111/acel.70696.

Aging cell (2026)

Read the original → https://doi.org/10.1111/acel.70696


Integrated Genomic and Proteomic Analysis Reveals T-B Lymphocyte Signatures in the MYCN Driven "Immune Desert" of Specific Neuroblastoma Subtypes.
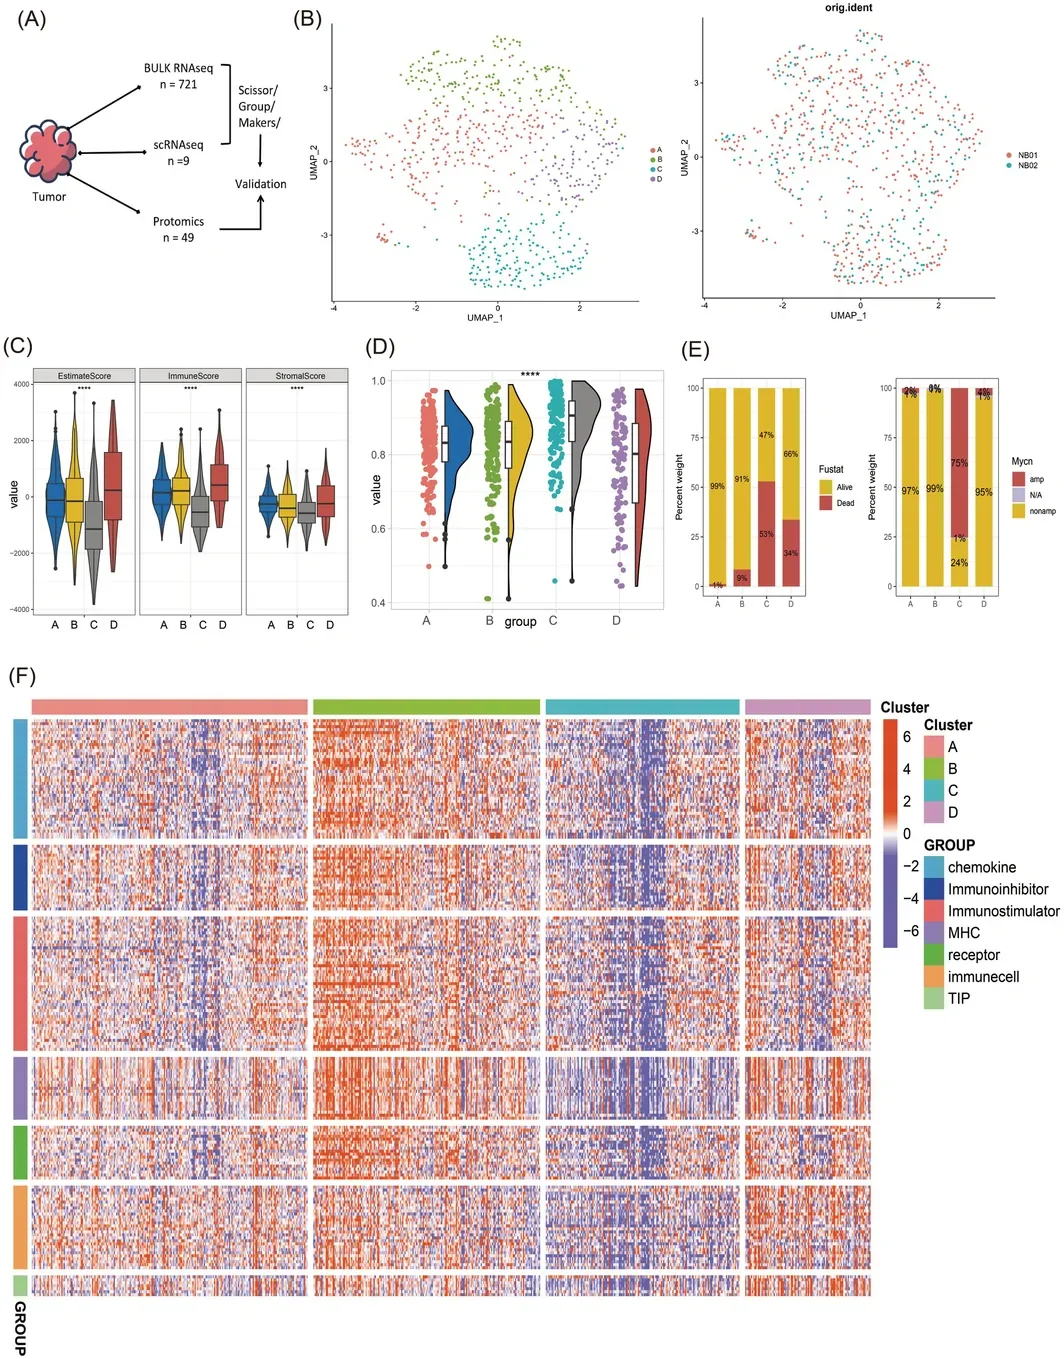
Identification and immune characterization of the MYCN‐driven “immune desert” subtype (Class C) in neuroblastoma. (A) Overview of the integrated multi‐omics cohorts. (B) UMAP plot of bulk RNA‐seq data from 721 samples defining four molecular subtypes (A–D). (C) Comparison of ESTIMATE algorithm‐derived scores (Immune, Stromal, ESTIMATE) and tumor purity across the four subtypes. (D) Violin plots comparing tumor purity between Class C and Non‐Class C (NOC) groups. (E) Enrichment of clinical features across the new subtypes. Stacked bar plots show the proportions of survival outcomes (Dead/Alive) and MYCN amplification status (amp, amplified; nonamp, non‐amplified) within each subtype (A–D). (F) Comprehensive immune landscape analysis across subtypes. Heatmaps display the relative enrichment scores, calculated using ssGSEA, for: 28 immune cell types (gene set from GSEA), activity of the 7‐step Cancer‐Immunity Cycle (gene set from TIP), and expression levels of immune‐related molecules including chemokines, MHC molecules, immunostimulators, immunosuppressors, and receptors (gene lists from TISIDB). Statistical significance: **** p < 0.0001. amp, amplified; NOC, Non‐Class C; nonamp, non‐amplified.

1 from Hu JJ et al., CNS neuroscience & therapeutics (2026). Licensed CC BY. Source: 10.1002/cns.71054.

CNS neuroscience & therapeutics (2026)

Read the original → https://doi.org/10.1002/cns.71054


Decoding cardiac homeostasis and injury: the evolving landscape of spatial transcriptomics
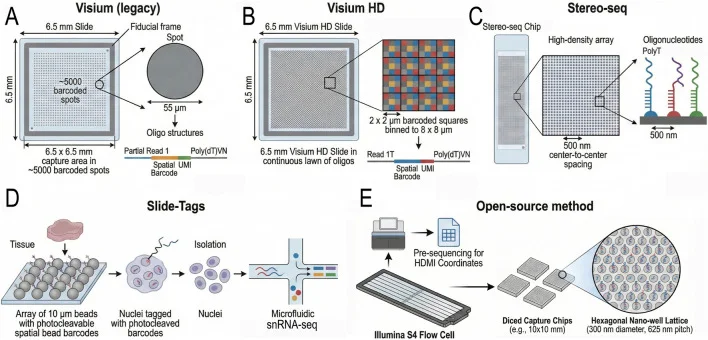
Overview of Sequencing-Based Spatial Transcriptomics (sST) Platforms. (A) The legacy Visium platform utilizes capture spots with a diameter of 55 µm. This resolution aggregates the transcriptomes of 2–10 cells, effectively obscuring cellular heterogeneity and necessitating computational deconvolution to infer cellular composition. (B) Visium HD employs 2 µm resolution bins to significantly improve spatial granularity, providing single-cell resolution across the whole transcriptome. (C) Stereo-seq utilizes DNA nanoball (DNB) technology on lithographically etched chips to achieve a spot size of 220 nm and a pitch of 500–715 nm. This nanoscale resolution enables the capture of transcripts with high spatial fidelity across large fields of view. (D) Slide-tags employs a strategy of spatial indexing where nuclei are tagged with photocleavable barcodes from an array of 10 µm beads prior to isolation. This method reconstructs spatial information computationally and is compatible with standard single-nucleus RNA sequencing workflows. (E) Open-source methods, such as Seq-Scope or Nova-ST, repurpose Illumina sequencing flow cells as ultra-high-density spatial arrays. By performing solid-phase amplification of randomly barcoded oligonucleotides directly on the flow cell surface, these methods generate RNA-capturing clusters spaced approximately 0.5 µm apart.

FIGURE 1 from Anis Hanna, Frontiers in Cell and Developmental Biology (2026). Licensed CC BY. Source: 10.3389/fcell.2026.1772507.

Frontiers in Cell and Developmental Biology (2026)

Read the original → https://doi.org/10.3389/fcell.2026.1772507


Pan-cancer single-cell landscape of tumor-infiltrating T cells
Conceptual illustration for: Pan-cancer single-cell landscape of tumor-infiltrating T cells

Science (2021) · 1187 citations

Read the original → https://doi.org/10.1126/science.abe6474


Atrial fibrillation variant-to-gene prioritization through cross-ancestry eQTL and single-nucleus multiomic analyses
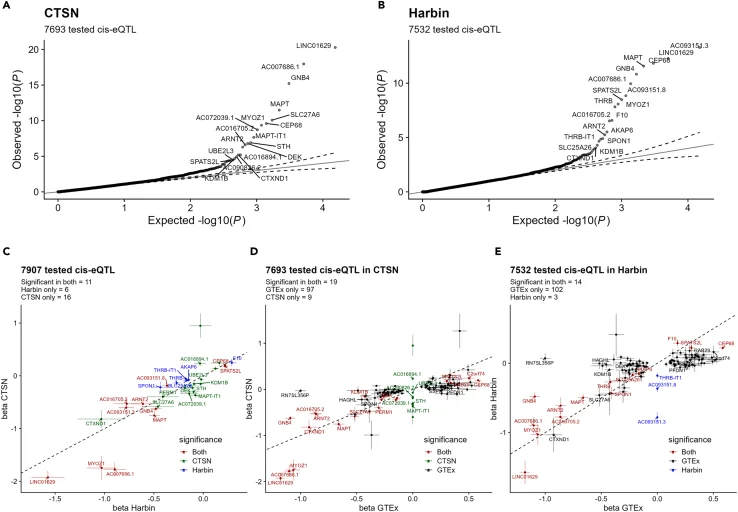
Expression quantitative trait locus (eQTL) mapping in human atrial tissue using RNA-sequencing (A and B) Quantile-quantile (QQ) plots of cis -eQTL –log10 ( p -values) for 150 sentinel atrial fibrillation (AF) SNPs and nearby genes (<1 Mb) in the (A) CTSN and (B) Harbin datasets. Dotted lines represent the 95% confidence interval of randomly generated normally distributed p -values. (C-E) Scatterplots comparing the eQTLs betas and their standard deviations from left atrial appendages (CTSN and Harbin) and right atrial appendages (Genotype-Tissue Expression; GTEx). (C) CTSN vs. Harbin, (D) CTSN vs. GTEx, (E) Harbin vs. GTEx. We attributed the value 0 to the eQTL if it was not tested in that cohort. (C–E) Colors indicate in which dataset(s) the eQTL is significant. eQTLs that were not significant in either of the paired cohorts are not shown for clarity. We added gene labels for the 20 most significant eQTLs in each cohort. Dotted lines represent x = y coordinates.

Figure 1 from F. Leblanc et al., iScience (2024). Licensed CC BY-NC-ND. Source: 10.1016/j.isci.2024.110660.

iScience (2024) · 9 citations

Read the original → https://doi.org/10.1016/j.isci.2024.110660


Microenvironment-aware spatial modeling for accurate inference of cell identity

Conceptual illustration for: Microenvironment-aware spatial modeling for accurate inference of cell identity

Nucleic Acids Research (2026)

Read the original → https://doi.org/10.1093/nar/gkaf1477


Quick links

Paper Venue / Year Link
Tissue-Level Transcriptomic Entropy Reveals Organ-Specific Aging Patterns and Predicts Cancer Progression. Aging cell (2026) Read →
Integrated Genomic and Proteomic Analysis Reveals T-B Lymphocyte Signatures in the MYCN Driven "Immune Desert" of Specific Neuroblastoma Subtypes. CNS neuroscience & therapeutics (2026) Read →
Decoding cardiac homeostasis and injury: the evolving landscape of spatial transcriptomics Frontiers in Cell and Developmental Biology (2026) Read →
Pan-cancer single-cell landscape of tumor-infiltrating T cells Science (2021) Read →
Atrial fibrillation variant-to-gene prioritization through cross-ancestry eQTL and single-nucleus multiomic analyses iScience (2024) Read →
Microenvironment-aware spatial modeling for accurate inference of cell identity Nucleic Acids Research (2026) Read →

Cancer Genomics Oncology Tumor Spatial Transcriptomics Spatial Omics Single-Cell Transcriptomics