Paper Outlook — 2026 年 10 月 5–11 日

· 10 min read · Paper Feed

Paper Outlook — 2026 年 10 月 5–11 日

本周速览

  • 空间组学与单细胞方法继续合流,被用来描绘牙龈、皮肤、脑膜以及肿瘤等组织里细胞的空间排布。
  • 多篇论文把这些组织图谱和具体疾病状态挂起钩来:牙龈炎症、胰腺癌里的恶病质、还有衰老皮肤的结构变化。
  • 临床基因组这边也有进展:全基因组测序(WGS)在儿童白血病遗传风险筛查中能稳定检出一些致病变异,但比例有限。
  • 方法层面上,RNA 与染色质并行的多组学图谱,加上单细胞、空间转录组与小鼠模型层层叠加的研究设计,正在把"基因表达快照"往更深处推。

Spatially resolved single cell atlas deciphers SAA1 inflammatory epithelial cells.

作者把人牙龈组织的单细胞 RNA 测序(scRNA-seq)和空间转录组数据与同一批样本的口腔菌群测序叠在一起,去看慢性炎症里上皮细胞出了什么事。结果指向一类由常见口腔细菌经特定分子通路诱导出来的炎症性上皮细胞,提示菌群是直接破坏牙龈屏障的"动手者",而不只是旁观者。这份图谱为理解牙周炎早期的细胞事件提供了一个入口,也可能指向新的治疗靶点。
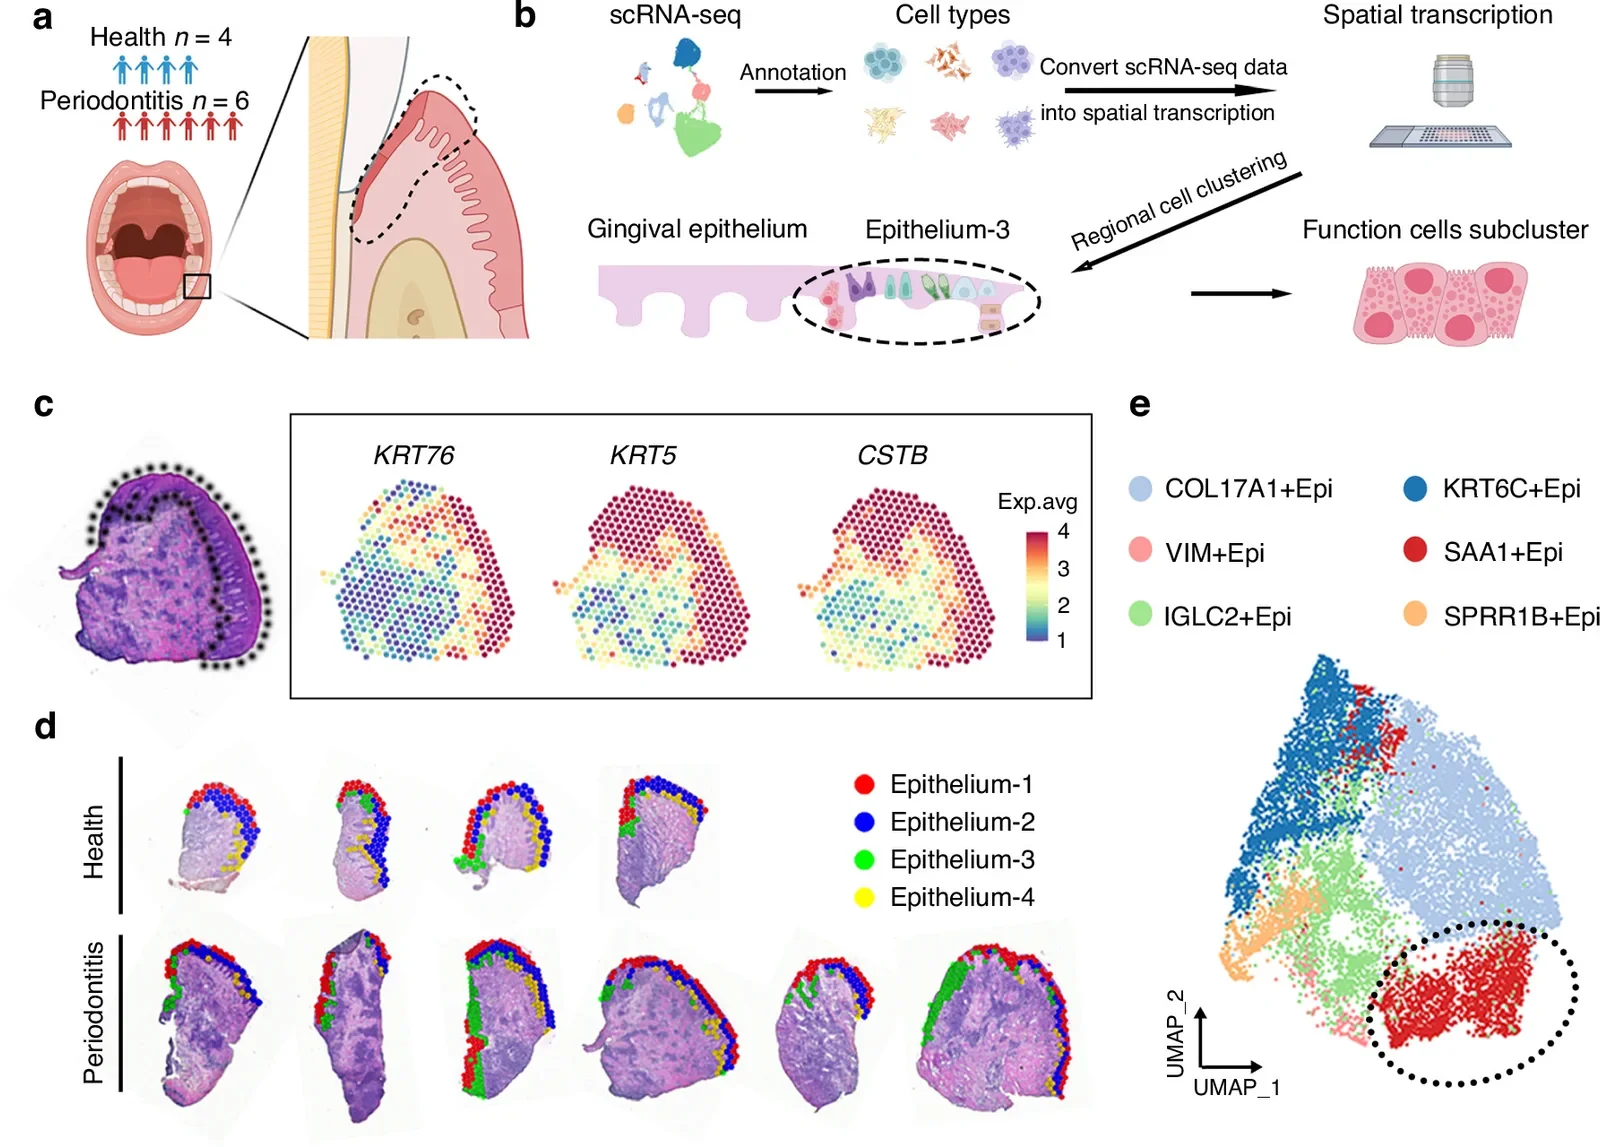
Spatial transcriptomics (ST) and scRNA-seq landscape in the gingival epithelium. a The gingival tissues were collected from 4 healthy controls and 6 periodontitis patients, and the gingival epithelium region. ST was performed on gingival tissues from 4 healthy controls and 6 periodontitis patients. scRNA-seq was performed on 2 healthy controls and 6 periodontitis patients. Because healthy gingival biopsies were limited in size and tissue allocation prioritized ST to preserve spatial information, paired ST and scRNA-seq data were available for only a subpopulation of healthy controls. b Schematic drawing of the combined scRNA-seq and ST. c The Epithelium in the slice of ST was recognized by marker genes ( KRT76 , KRT5 , CSTB ). d A dot plot showing the 4 major subclusters in different colors in the health group ( n = 4) and periodontitis group ( n = 6). e Uniform manifold approximation and projection (UMAP) of epithelial cell subclusters. The black circle indicates SAA1 +Epi

Fig. 1,出自 Wu Y 等, International journal of oral science (2026)。许可协议 CC BY-NC-ND。来源:10.1038/s41368-026-00464-1。

International journal of oral science (2026)

阅读原文 → https://doi.org/10.1038/s41368-026-00464-1


Single-Nucleus Transcriptomic Atlas of Human Vellus Hair Pilosebaceous Units Reveals Age-Associated Remodeling.

作者用单核 RNA 测序(snRNA-seq)构建了人背部皮肤毛囊皮脂腺单位(PSU,也就是产皮脂、附着小汗毛的那类微器官)的图谱,并把年轻男性和年长男性放在同一坐标系下比较。衰老带来的变化相当广泛:毛囊隆突区的干细胞相对占比下降,激素响应和脂质合成相关程序也有明显改写。对想研究皮肤衰老或相关疾病的人来说,这份图谱是份比较顺手的参考资源。
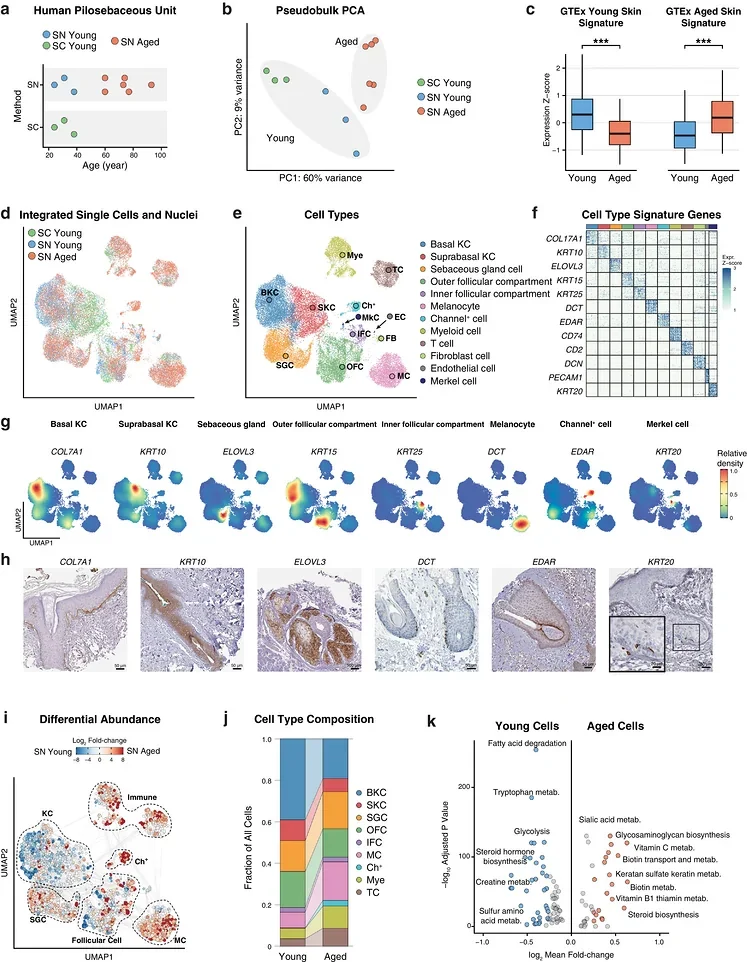
Age‐associated cellular reprogramming in human pilosebaceous units revealed by single‐nucleus transcriptomics. (a) Overview of donor age distribution of the cohort and profiling strategies. SN, single‐nucleus; SC, single‐cell. (b) Principal component analysis (PCA) of pseudobulk analysis of all samples. (c) Box plot showing per‐cell expression z‐scores of skin aging signature genes derived from the Genotype‐Tissue Expression (GTEx) database. *** : p < 0.001, by two‐tailed Student's t ‐test. Box plots indicate median (center line), 25th–75th percentiles (bounds of box), and whiskers extend to 1.5× IQR. (d) Uniform manifold approximation and projection (UMAP) representation of integrated snRNA‐seq and scRNA‐seq data, colored by donor age group and data type. (e) UMAP colored by major PSU cell clusters. (f) Heatmap of cell type‐enriched genes with representative signature genes indicated on the left; each column represents a cell type shown in (e). (g) Nebulosa density plots showing representative signature gene expression patterns across the dataset. (h) Representative immunohistochemistry images from the Human Protein Atlas (HPA)  26  illustrating the anatomical localization of major PSU cell layers. Images are reproduced under the Creative Commons Attribution 4.0 International License (CC BY 4.0). Image credit: Human Protein Atlas. Image‐specific source information is provided in Table S1 . Scale bars as indicated. (i) Milo differential abundance testing across all single nuclei. Nodes represent neighborhoods colored by log 2 fold‐change between age groups; edges indicate shared cell numbers between neighborhoods. (j) Composition of major cell types identified in the snRNA‐seq data comparing two age groups. (k) Pathway‐level comparison of metabolic programs highlighting global metabolic shifts between young and aged PSUs.

Fig. 1,出自 Li Y 等, Advanced Science (2026)。许可协议 CC BY。来源:10.1002/advs.78048。

Advanced Science (2026)

阅读原文 → https://doi.org/10.1002/advs.78048


Diagnostic yield of cancer predisposition in a nationwide prospective childhood acute leukemia cohort.

一项全国性、前瞻性、基于人群的研究,对新诊断的 181 例儿童急性白血病患者做 WGS,目的只有一个:在真实临床场景下,看这套检测能从多少人里捞出可遗传的肿瘤易感变异。作者用了"三路并进"的策略——系统表型分析、胚系 189 基因 panel 测序,外加阳性病例的肿瘤测序——并在 11 个高疑家庭里加做了三人组 WGS(trio-WGS)。整体来看,约 5% 的患儿携带临床意义上的致病/可能致病变异,覆盖白血病和实体瘤相关基因。结果支持在诊断阶段就用更全面的测序替代单基因排查,但同时也得承认:检出率终归有限,临床解读必须谨慎。
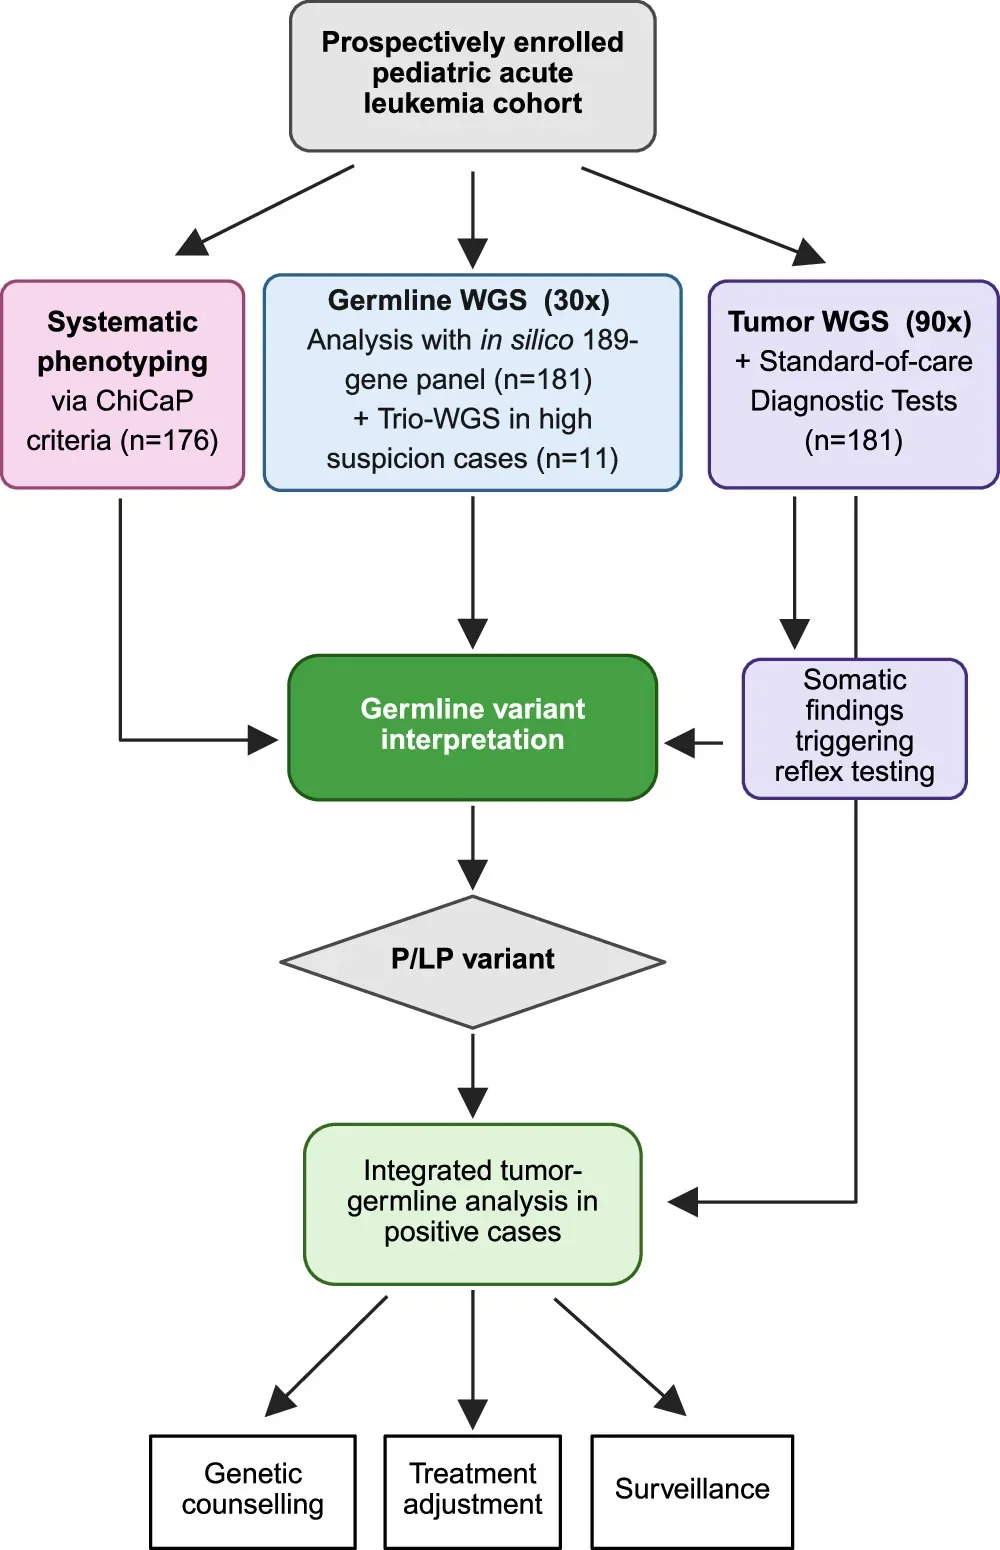
Three-pronged diagnostic strategy. The strategy combines systematic phenotyping, germline WGS-based analysis of a 189-gene panel, and analysis of tumor sequencing data of positive cases. Children with newly diagnosed acute leukemia ( n = 181) were prospectively enrolled and evaluated through three parallel arms. Systematic clinical phenotyping was performed in 176 patients using the childhood cancer predisposition (ChiCaP) criteria. Germline whole-genome sequencing was undertaken in 181 patients and analyzed with an in silico 189-gene panel. Trio-WGS was performed in 11 cases with a high suspicion of a predisposition. In parallel, tumor WGS (90x coverage) was performed alongside standard-of-care diagnostic testing in the same patients; somatic findings suggestive of an underlying germline variant triggered reflex testing. Phenotypic, germline, and reflex-derived data were jointly considered during germline variant interpretation to identify pathogenic (P) or likely pathogenic (LP) variants. In patients harboring a P/LP variant, integrated tumor-germline analysis was performed to refine clinical actionability, informing genetic counseling, treatment adjustment, and long-term surveillance recommendations for patients and at-risk relatives. Created in BioRender. Taylan, F. (2026) https://BioRender.com/qmt8k5v .

Fig. 1,出自 Taylan F 等, Nature communications (2026)。许可协议 CC BY。来源:10.1038/s41467-026-78170-z。

Nature communications (2026)

阅读原文 → https://doi.org/10.1038/s41467-026-78170-z


Spatial evolution of a cachexia-promoting microenvironment in pancreatic cancer.

恶病质(癌症患者里常见的严重消瘦综合征)一直是胰腺癌预后差的重要原因,但"肿瘤里到底哪群细胞在向全身发号施令"这件事一直没讲清。作者把单细胞测序、Xenium 空间转录组、多重免疫组化、批量转录组和小鼠模型串起来,把样本按非恶病质/恶病质前期/恶病质切成三档看,逐步勾出一个由特定肿瘤细胞亚群、特定巨噬细胞和成纤维细胞组成的三方"作恶小团体"。这套图谱把通路定位到了空间邻域层面,为日后针对肿瘤相关恶病质的干预提供了一些抓手。

概念插图:Spatial evolution of a cachexia-promoting microenvironment in pancreatic cancer.

Cell (2026)

阅读原文 → https://doi.org/10.1016/j.cell.2026.09.012


Spatially resolved multiomics of human meningeal development reveal lineage and disease dynamics.

脑膜近年来被越来越多地当成颅内发育的"基质+免疫"双重生态位来研究,但人发育期的高分辨率多组学图谱一直缺位。作者搭了一套配对的单核 RNA + ATAC(转座酶可及染色质测定)图谱,覆盖妊娠 6–21 周、跨多个颅区,再叠上空间转录组,把不同层次脑膜里的细胞类型拆开来看。血脑屏障内皮细胞和脑驻留巨噬细胞等群体在发育过程中如何被"组装"起来,这份数据交代得比较清楚。同期还发布了两款配套分析工具,让图谱本身也变成了一个能直接用的资源。

概念插图:Spatially resolved multiomics of human meningeal development reveal lineage and disease dynamics.

Nature cell biology (2026)

阅读原文 → https://doi.org/10.1038/s41556-026-02075-8


快速链接

论文 期刊 / 年份 链接
Spatially resolved single cell atlas deciphers SAA1 inflammatory epithelial cells. International journal of oral science (2026) 阅读 →
Single-Nucleus Transcriptomic Atlas of Human Vellus Hair Pilosebaceous Units Reveals Age-Associated Remodeling. Advanced Science (2026) 阅读 →
Diagnostic yield of cancer predisposition in a nationwide prospective childhood acute leukemia cohort. Nature communications (2026) 阅读 →
Spatial evolution of a cachexia-promoting microenvironment in pancreatic cancer. Cell (2026) 阅读 →
Spatially resolved multiomics of human meningeal development reveal lineage and disease dynamics. Nature cell biology (2026) 阅读 →

五篇放一起看,本周一个比较明显的信号是:单细胞和空间组学已经走出"画图谱"的早期阶段,开始被用来回答具体的疾病问题——从牙周炎里菌群怎么动手,到胰腺癌恶病质的细胞共谋,再到脑膜发育里屏障细胞怎么被组装起来。剩下那块比较空的拼图是:这些图谱的临床转化能不能在下一个五年里走出一个真正落地的标志物或干预点?

Single-Cell Transcriptomics scRNA-seq Genomics Cancer Oncology Tumor Spatial Transcriptomics