Paper Outlook — October 5-11, 2026

TL;DR
- Spatial and single-cell methods keep getting combined to map how cells organize inside tissues, from gum and skin to brain linings and tumors.
- Several studies this week use these maps to link specific cell types to disease states, including inflammation in gums, wasting in pancreatic cancer, and remodeling in aging skin.
- Clinical genomics is also gaining ground, with whole-genome sequencing showing real, though modest, value for identifying inherited risks in childhood leukemia.
- Methodologically, paired RNA-plus-chromatin atlases and designs that stack single-cell, spatial and mouse data are pushing the field beyond simple gene expression snapshots.
Spatially resolved single cell atlas deciphers SAA1 inflammatory epithelial cells.
Researchers combined single-cell and spatial gene expression mapping of human gum tissue with microbiome data to study chronic inflammation. They identified a specific inflammatory epithelial cell type triggered by a common oral bacterium through a particular molecular pathway, which helps explain how microbes directly disrupt the gum barrier. The work offers a starting point for understanding the early cellular events behind periodontitis and may point to new therapeutic targets.
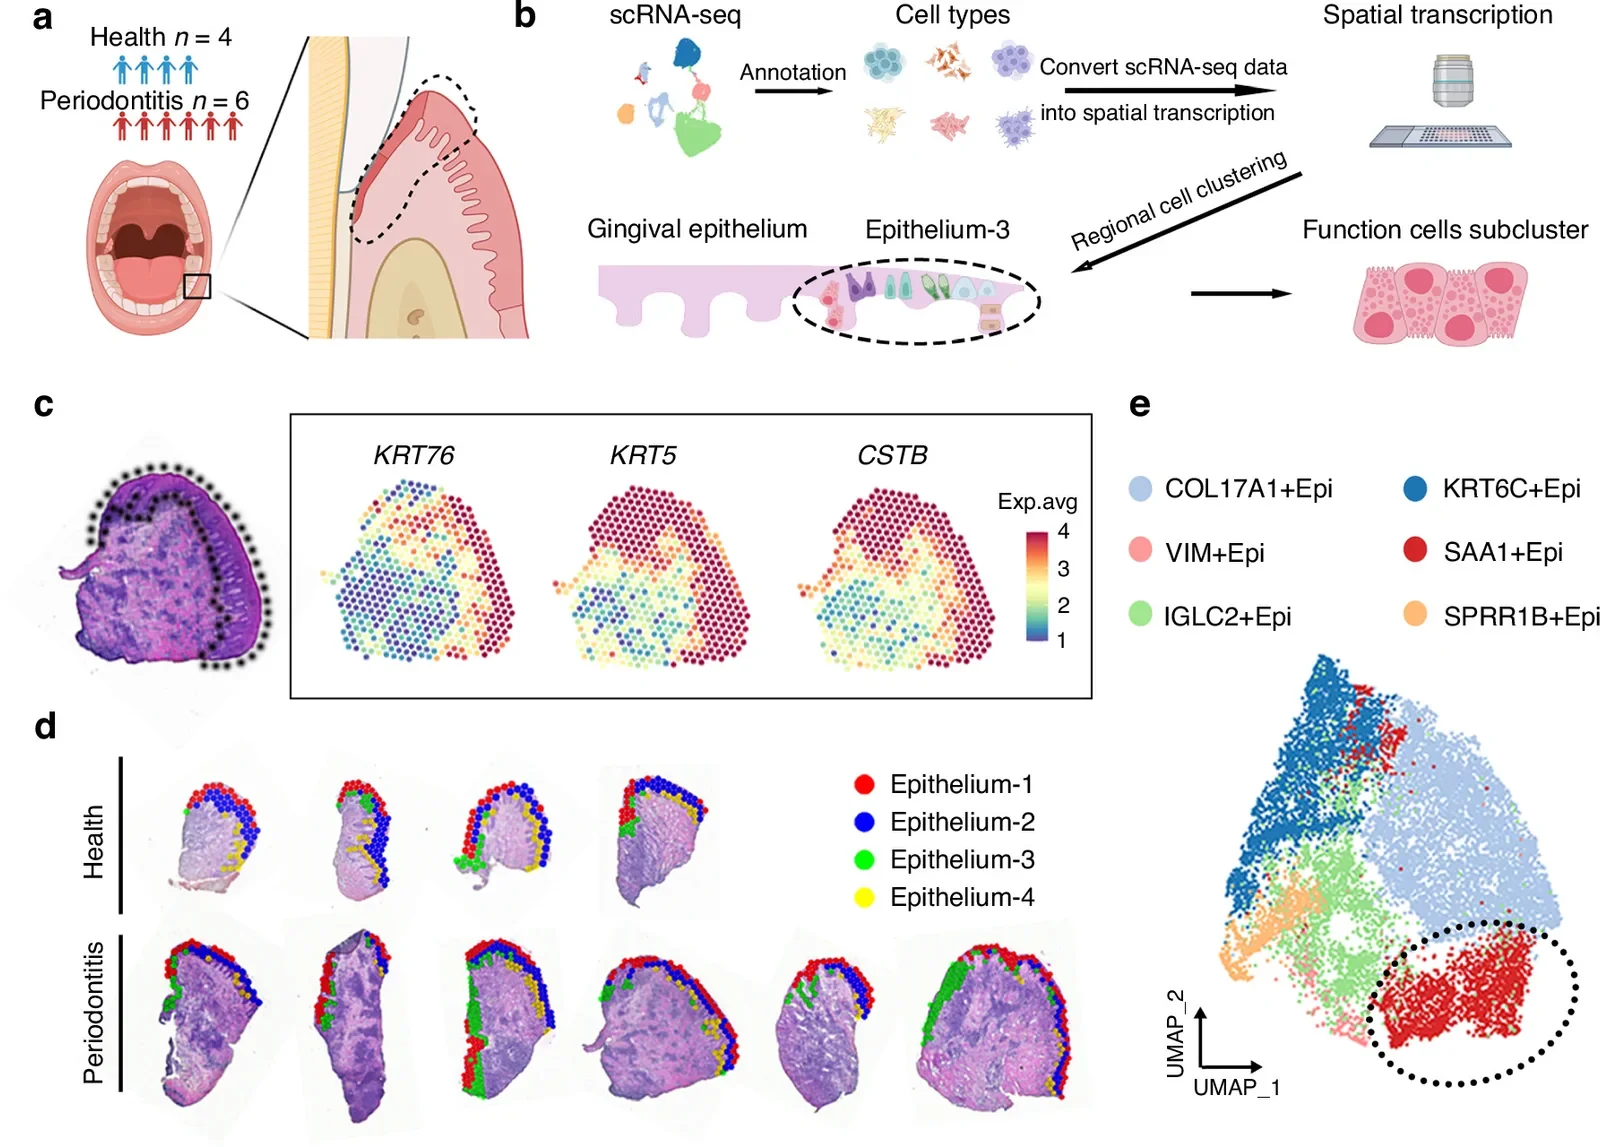
Fig. 1 from Wu Y et al., International journal of oral science (2026). Licensed CC BY-NC-ND. Source: 10.1038/s41368-026-00464-1.
International journal of oral science (2026)
Read the original → https://doi.org/10.1038/s41368-026-00464-1
Single-Nucleus Transcriptomic Atlas of Human Vellus Hair Pilosebaceous Units Reveals Age-Associated Remodeling.
The study built a gene activity map of the tiny oil-producing and hair structures (pilosebaceous units) in human back skin, comparing young and older men. Aging reshapes stem cell populations, hormone responses, and lipid production in these skin niches. The dataset is a useful reference for work on skin aging and related disorders.
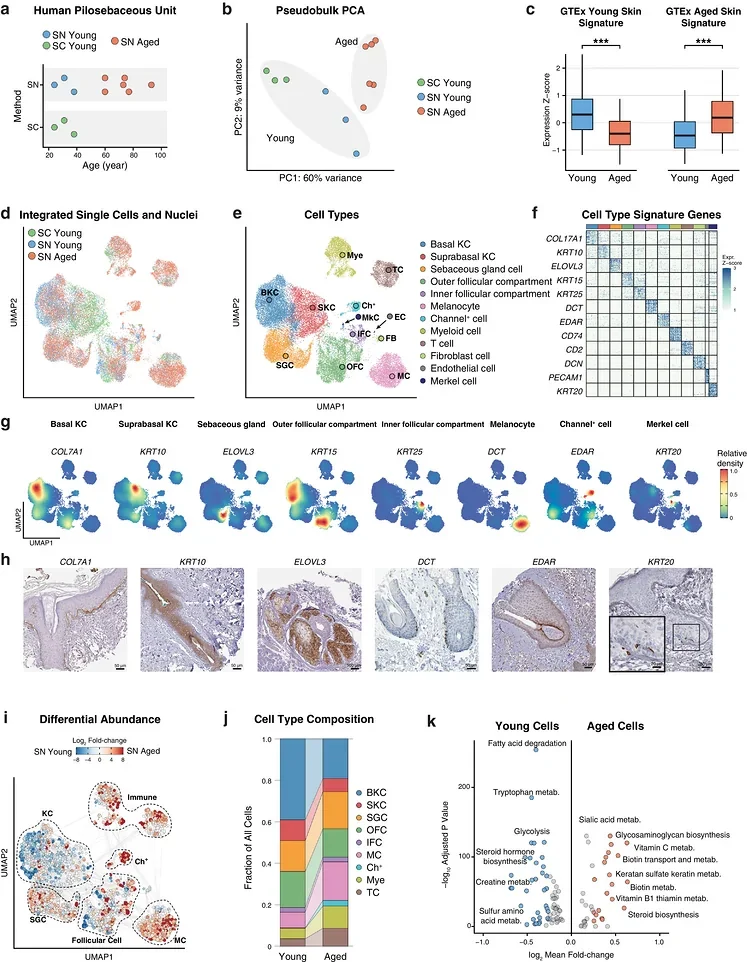
Fig. 1 from Li Y et al., Advanced Science (2026). Licensed CC BY. Source: 10.1002/advs.78048.
Advanced Science (2026)
Read the original → https://doi.org/10.1002/advs.78048
Diagnostic yield of cancer predisposition in a nationwide prospective childhood acute leukemia cohort.
A nationwide prospective study applied whole-genome sequencing to children newly diagnosed with acute leukemia to see how often inherited cancer-risk mutations could be found. About 5% of patients carried meaningful predisposition variants, spanning both leukemia- and solid tumor-related genes. The findings support a more comprehensive sequencing approach at diagnosis, though the overall yield remains modest and needs careful clinical interpretation.
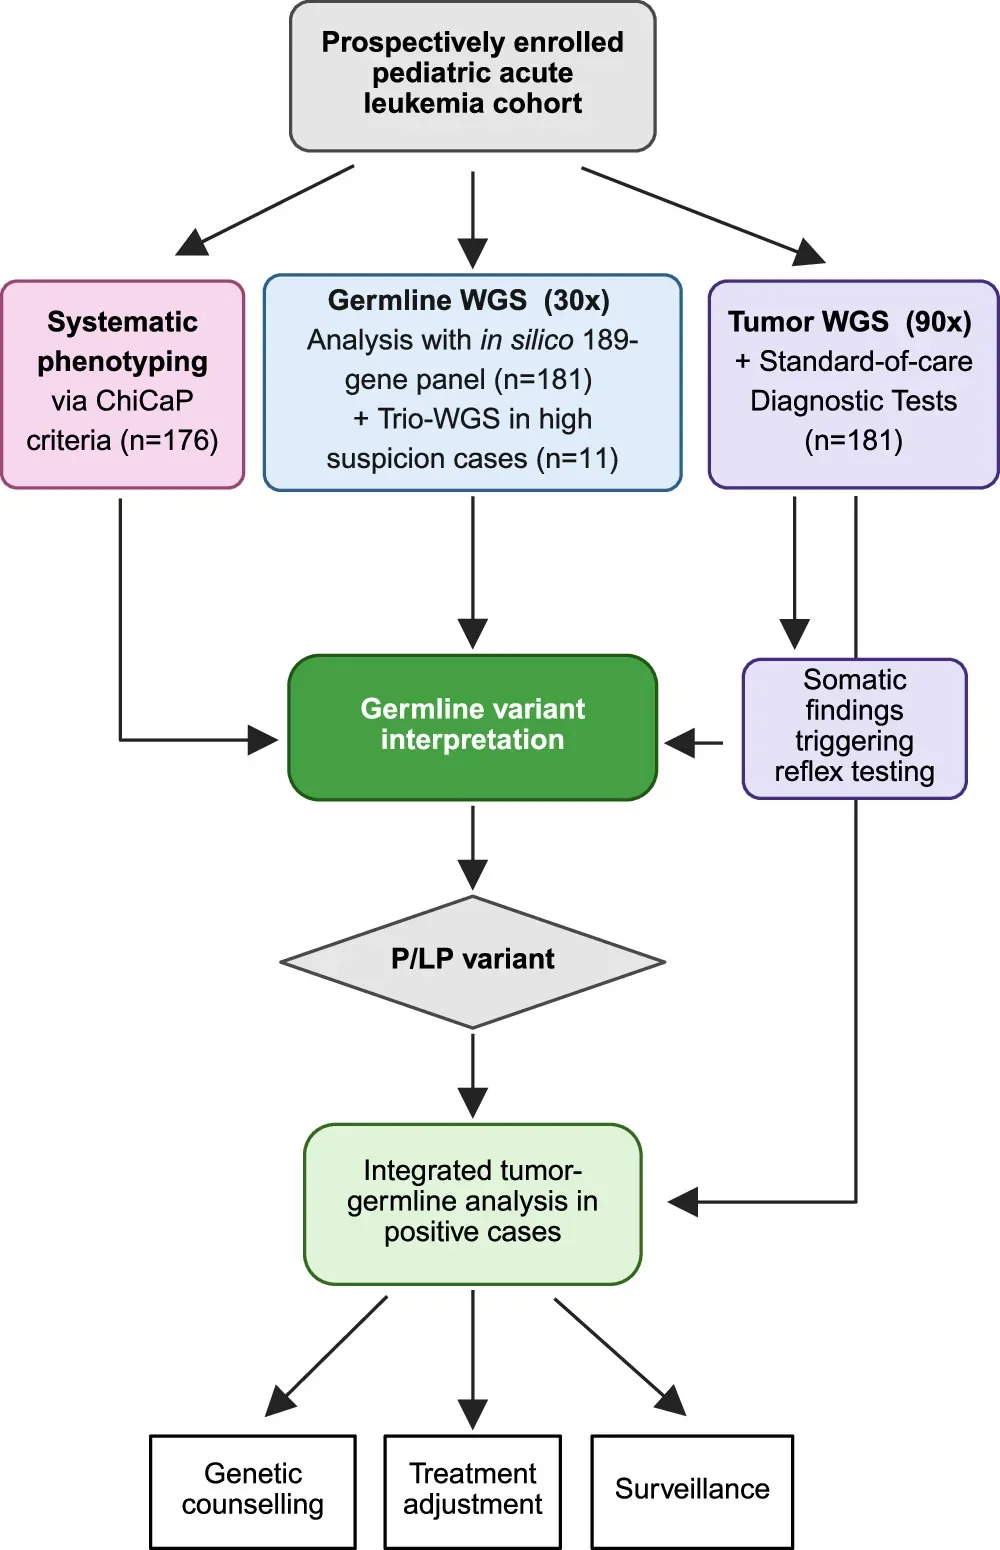
Fig. 1 from Taylan F et al., Nature communications (2026). Licensed CC BY. Source: 10.1038/s41467-026-78170-z.
Nature communications (2026)
Read the original → https://doi.org/10.1038/s41467-026-78170-z
Spatial evolution of a cachexia-promoting microenvironment in pancreatic cancer.
By layering single-cell, spatial, and mouse experiments, researchers mapped the cellular neighborhood in pancreatic tumors that drives cachexia, the severe weight-loss syndrome seen in many cancer patients. They identified a three-way interaction between a tumor cell subtype, a specific macrophage, and a fibroblast population that together trigger muscle wasting. The map highlights new angles for intervening in cancer-related cachexia.
Cell (2026)
Read the original → https://doi.org/10.1016/j.cell.2026.09.012
Spatially resolved multiomics of human meningeal development reveal lineage and disease dynamics.
The team built a paired gene-expression and chromatin-accessibility atlas of the developing human meninges, the membranes surrounding the brain, covering early to mid-gestation and multiple cranial regions. Integrating spatial data, they traced how blood-brain barrier cells and immune populations, including brain-resident macrophages, are established during development. Two new analytical tools ship with the atlas, making it a broad resource for neurodevelopment and disease research.

Nature cell biology (2026)
Read the original → https://doi.org/10.1038/s41556-026-02075-8
Quick links
| Paper | Venue / Year | Link |
|---|---|---|
| Spatially resolved single cell atlas deciphers SAA1 inflammatory epithelial cells. | International journal of oral science (2026) | Read → |
| Single-Nucleus Transcriptomic Atlas of Human Vellus Hair Pilosebaceous Units Reveals Age-Associated Remodeling. | Advanced Science (2026) | Read → |
| Diagnostic yield of cancer predisposition in a nationwide prospective childhood acute leukemia cohort. | Nature communications (2026) | Read → |
| Spatial evolution of a cachexia-promoting microenvironment in pancreatic cancer. | Cell (2026) | Read → |
| Spatially resolved multiomics of human meningeal development reveal lineage and disease dynamics. | Nature cell biology (2026) | Read → |
Read together, the five papers show single-cell and spatial methods moving past the atlas-for-its-own-sake stage and into specific disease questions: how an oral bacterium turns gum epithelium inflammatory, which three cell types conspire to drive cachexia in pancreatic cancer, and how barrier cells and brain-resident macrophages are assembled in the developing meninges. The piece still missing is clinical translation. The leukemia cohort is the closest thing here to routine practice, and even there the yield is about 5%. Whether any of these maps produces a marker or an intervention that reaches the clinic in the next five years is the question worth tracking.