Paper Outlook — 2026 年 8 月 17-23 日

· 5 min read · Paper Feed

Paper Outlook — 2026 年 8 月 17-23 日

速览概览

  • 本周精选大致分两条线:一条是关于肿瘤微环境的新生物学认识,涉及中性粒细胞和成纤维细胞;另一条是让单细胞与空间转录组数据更好解读的计算工具。
  • 两篇与空间转录组相关——空间转录组能在保留组织位置的前提下测量基因表达:其中一篇提出了一种方法,用来寻找那些表达水平沿着组织结构平滑变化的基因;另一篇则在 50 个数据集上系统比较了 18 种细胞类型解卷积(deconvolution)工具,输出了实用的选型建议。
  • 深度学习的可解释性在本周继续往前走了一步:基于 Transformer 的细胞类型注释工具 TOSICA 以通路这类生物学单元作为"词汇表";多任务网络 UnitedNet 则展示了同一个细胞内不同分子层之间如何相互关联。
  • 对肿瘤研究者来说,本周最值得留意的生物学发现是:肿瘤周围那些原本被视作旁观者的细胞——哪怕是寿命很短的中性粒细胞——一旦进入肿瘤,会被稳定地重编程到驱动疾病进展的状态,并且这种状态与患者预后挂钩。

肿瘤内中性粒细胞的确定性重编程

这项工作表明,中性粒细胞(一种寿命很短的免疫细胞)一旦进入肿瘤,会经历永久性的基因与蛋白表达重编程,最终锁定在一个单一的终末状态上,而这个状态会促进血管生成。这些被重塑的细胞集中在肿瘤核心区——一个低氧、缺糖的微环境。论文把中性粒细胞从旁观者重新拉回到舞台中央:它们是癌症进展的主动参与者,也是一个值得考虑的治疗切入点。
概念插图:Deterministic reprogramming of neutrophils within tumors

Science (2024) · 335 次引用

阅读原文 → https://doi.org/10.1126/science.adf6493


癌相关成纤维细胞表型与非小细胞肺癌患者预后相关

研究团队用高分辨率的组织成像技术分析了超过 1,000 名肺癌患者,从中归纳出 11 种成纤维细胞亚型,并将它们归为 4 种能够预测生存时间的模式。其中一种富含"类肿瘤"成纤维细胞的模式与较差预后显著相关。这项研究把这类支持细胞确立为一个独立的预后风险因素,也为个体化治疗提供了一个可考虑的方向。
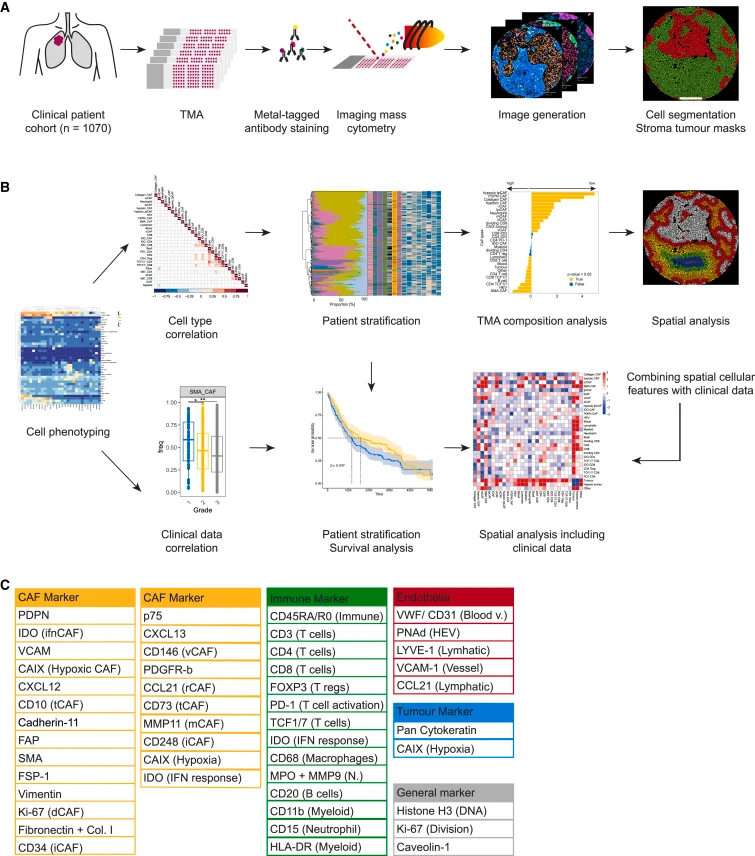
Overview of experimental and analytical set-up (A) Experimental set-up. NSCLC samples (2070 cores, 1,070 patients) and controls were stained with metal-tagged antibodies and imaged using IMC. Cell and tumor-stroma masks were generated. (B) Analytical setup. Single-cell data were used to identify cell phenotypes, and to evaluate correlations between cell types and clinical data. CAF based patient stratifications were used for survival and TMA composition analyses. Finally, spatial properties of CAFs and immune cell types were analyzed and integrated with clinical data. (C) Markers in the antibody panel.

Figure 1,出自 L. Cords 等, Cancer Cell (2024)。许可协议 CC BY-NC-ND。来源:10.1016/j.ccell.2023.12.021。

Cancer Cell (2024) · 264 次引用

阅读原文 → https://doi.org/10.1016/j.ccell.2023.12.021


在空间转录组研究中推断与组织学相关的基因表达梯度

作者提出了 Spatial Gradient Screening(空间梯度筛选)工具。它不需要把数据硬塞进预设的分组,就能在空间基因表达图谱上扫描,找出那些活性随组织学可见特征平滑变化的基因。他们在受伤的小鼠脑组织和人脑肿瘤样本上做了验证。这个方法有望揭示一些被传统基于分组的设计漏掉的、由位置驱动的细微基因模式。
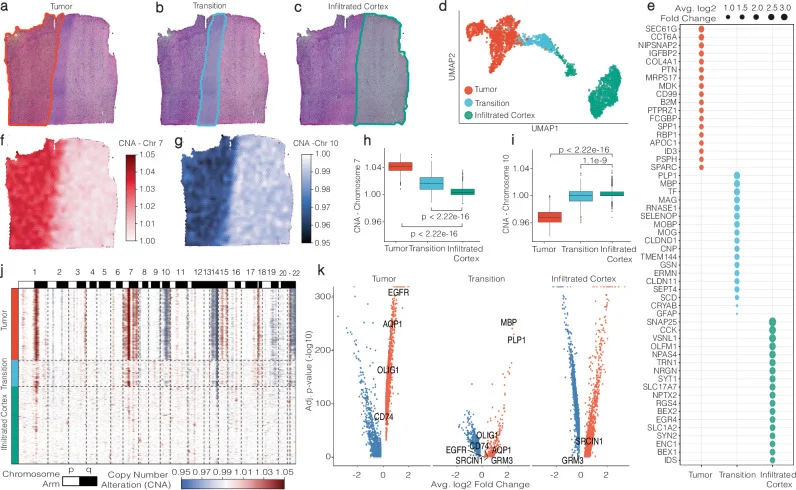
Histologically defined group-based analysis. a – c SPATA’s manual annotation tool is employed to delineate borders, facilitating the grouping of spots based on histology. d Gene expression-driven UMAP projection of spots. e A dot plot showcases the 18 most statistically significant unique marker genes, ranked by their average log2-fold change, in accordance with histological areas. f and g Surface plots are color-coded to highlight inferred copy number alterations that are characteristic of glioblastoma. h and i Statistical analyses examine copy number alterations across histological areas (two-sided test, no adjustments for multiple comparisons, Tumor ( n = 1307), Transition ( n = 478), Infiltrated Cortex ( n = 1428). The minima represent the smallest and the maxima represent the largest value within 1.5 times the interquartile range (IQR) below or above the first or third quartile (Q1, Q3), respectively. The median is shown as a line inside the box. The box bounds are the first quartile (Q1, 25th percentile) and the third quartile (Q3, 75th percentile). The whiskers extend from Q1 and Q3 to the minima and maxima. j A heatmap provides a comprehensive view of alterations across all chromosomes in relation to histological areas, corroborating the tumor area’s classification with multiple alterations, the nearly unaltered cortex infiltrated by the tumor, and the transition zone exhibiting intermediate levels of alterations. k A volcano plot from the DEA analysis across histological areas highlights marker genes for the Tumor and Transition areas, characterized by an adjusted p -value of 0 (infinite −log10).

Fig. 1,出自 J. Kueckelhaus 等, Nature Communications (2024)。许可协议 CC BY。来源:10.1038/s41467-024-50904-x。

Nature Communications (2024) · 74 次引用

阅读原文 → https://doi.org/10.1038/s41467-024-50904-x


空间转录组细胞反卷积的综合基准测试与实用指南

这项基准研究系统比较了 18 种用于估算空间转录组每个点位内混合细胞组成的计算方法,涵盖了 50 个真实与模拟数据集。作者从准确性、稳健性、易用性等多个角度打分,并整理出一份工具选型指南。打算开展空间转录组实验的人,把这篇当成选工具前的参考资料会比较稳妥。
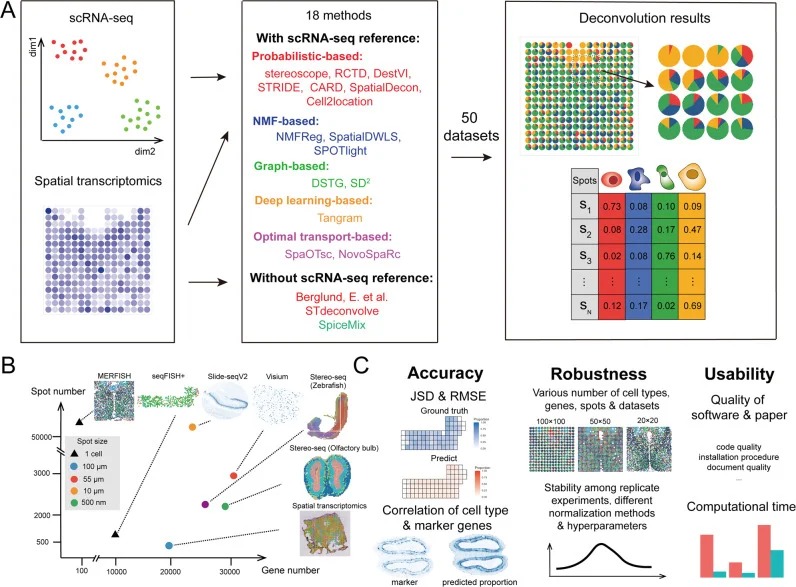
The summarization of benchmarking pipeline. A Eighteen cellular deconvolution methods, classified based on their data requirements and computational techniques, were evaluated with 50 simulated and real-world spatial transcriptomics datasets. B Datasets from six spatial transcriptomics technologies were used for benchmarking, and the scatter plot shows the resolution of each spot and number of spots and genes in each technology. C The benchmarking results were measured according to the accuracy, robustness, and usability of the methods.

Fig. 1,出自 Haoyang Li 等, Nature Communications (2023)。许可协议 CC BY。来源:10.1038/s41467-023-37168-7。

Nature Communications (2023) · 235 次引用

阅读原文 → https://doi.org/10.1038/s41467-023-37168-7


基于 Transformer 的一站式可解释细胞类型注释

TOSICA 是一个基于 Transformer 架构的深度学习模型。它把基因通路这类有生物学含义的输入(而不是裸基因列表)作为特征,把细胞类型标签从带注释的参考数据集自动迁移到新的单细胞数据集。速度与准确率都还不错,注意力权重还能告诉你每个标签背后主要由哪些通路在驱动。这样一来,大规模细胞注释既有可重复性,也比很多现有工具更容易解读。
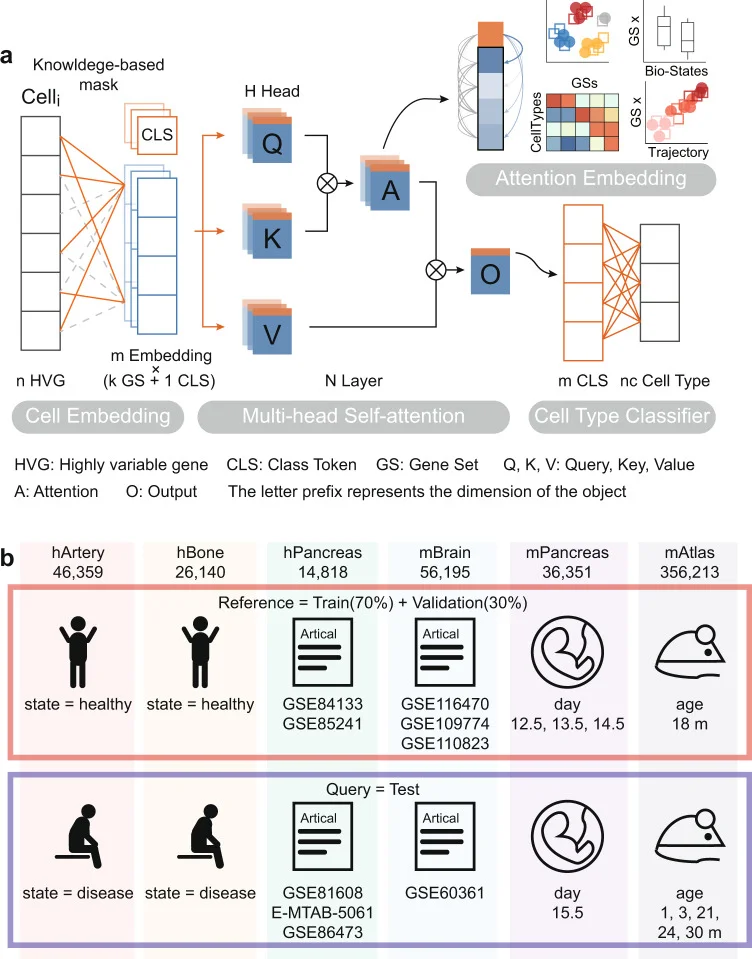
Algorithmic framework of TOSICA. a The model is trained on single-cell RNA sequencing data and cell type label for each cell. Based on databases or expert knowledge, masked learnable embeddings are used to convert the reference input data (n genes) to k input tokens representing each gene set (GS), to which class token (CLS) is added. In the attention function, query (Q), key (K), and value (V) matrix are linearly projected from these GSs and CLS combined tokens and the weights (attention, A) is computed by a compatibility function of the Q with the corresponding K, then assigned to each V for computing output (O). In each Multi-head Self-attention layer, the attention function is performed H times in parallel. The CLS of O, considered as latent space of each cell, is used as input of the whole conjunction neural network cell type classifier. Meanwhile, the attention of class (CLS) token to gene set (GS) tokens is referred as attention score and used for cell embedding. b hArtery and hBone datasets use healthy samples as training data and predict disease samples. hPancreas and mBrain datasets are split by data source. Training and test data in mPancreas and mAtlas come from different timepoints.

Fig. 1,出自 Jiawei Chen 等, Nature Communications (2023)。许可协议 CC BY。来源:10.1038/s41467-023-35923-4。

Nature Communications (2023) · 202 次引用

阅读原文 → https://doi.org/10.1038/s41467-023-35923-4


用于多模态生物数据分析的可解释多任务学习

UnitedNet 是一个神经网络框架,用来同时处理那些在多个分子层(RNA 表达、DNA 可及性、蛋白丰度等)上都有测量的单细胞数据,并把多项分析任务联合起来跑。它既能整合不同分子层,又能以细胞类型特异性的方式解释这些层之间的基因调控联系。作者的设想是:让生物学家只用一个模型,就能看清同一个细胞内不同分子程序之间的关联。
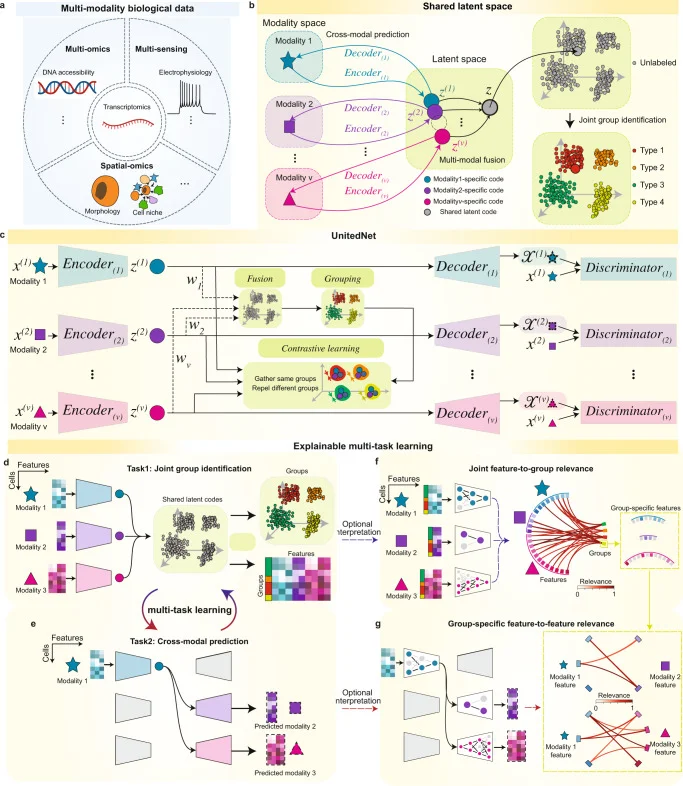
Multi-task learning of multi-modality biological data by UnitedNet. a Schematics of representative multi-modality biological data: (i) simultaneously measured transcriptomics and intracellular electrophysiology (multi-sensing data), (ii) integratively profiled transcriptomics and DNA accessibility (multi-omics data), and (iii) spatially resolved transcriptomics and proteomics (spatial omics data). b Schematics of designation of the shared-latent space. Different modality measurements from the same cell can be projected to a shared latent space as latent codes by encoders. The latent codes can be projected back to the modality space by decoders. In the latent space, latent codes representing different modalities from the same cell can be integrated as a unimodal shared latent code used for joint group identification. c Schematics showing the network structure of UnitedNet based on the shared-latent space designed in ( b ). d , e Schematics showing the multi-task learning between joint group identification ( d ) and cross-modal prediction ( e ) by UnitedNet for analyzing multi-modality data. f , g Schematics showing the application of explainable learning methods to dissect the trained UnitedNet for identifying group-to-feature relevance ( f ) and the cross-modal feature-to-feature relevance ( g ). First, an explainable learning method dissects the encoders of a trained UnitedNet to identify the most relevant input features to each group ( f ). Then, within the grouped input features from ( f ), the explainable learning method further dissects the encoders and decoders of the trained UnitedNet to identify group-specific cross-modal feature-to-feature relevance ( g ). The drawings in panel a were created with BioRender.com.

Fig. 1,出自 Xin-Hui Tang 等, Nature Communications (2023)。许可协议 CC BY。来源:10.1038/s41467-023-37477-x。

Nature Communications (2023) · 107 次引用

阅读原文 → https://doi.org/10.1038/s41467-023-37477-x


快速链接

论文 期刊 / 年份 链接
肿瘤内中性粒细胞的确定性重编程 Science (2024) 阅读 →
癌相关成纤维细胞表型与非小细胞肺癌患者预后相关 Cancer Cell (2024) 阅读 →
在空间转录组研究中推断与组织学相关的基因表达梯度 Nature Communications (2024) 阅读 →
空间转录组细胞反卷积的综合基准测试与实用指南 Nature Communications (2023) 阅读 →
基于 Transformer 的一站式可解释细胞类型注释 Nature Communications (2023) 阅读 →
用于多模态生物数据分析的可解释多任务学习 Nature Communications (2023) 阅读 →

Cancer Genomics Oncology Tumor Spatial Transcriptomics Spatial Omics Single-Cell Transcriptomics