Paper Outlook — August 17-23, 2026
TL;DR
- This week's picks split into two camps: new biology about the cellular neighborhood of tumors (neutrophils and fibroblasts), and new computational tools that make single-cell and spatial gene-expression data easier to work with.
- Two papers tackle spatial transcriptomics, the technology that maps gene activity across a tissue. One introduces a method for finding genes whose expression smoothly tracks with features visible under the microscope; the other compares 18 cell-type-mixing tools across 50 datasets and offers practical guidance.
- Deep learning keeps inching toward interpretability: a Transformer-based cell-typing tool (TOSICA) uses biological concepts like pathways as its vocabulary, and a multi-task network (UnitedNet) explains how different molecular layers inside the same cell relate to each other.
- For cancer researchers, the takeaway is that the cells surrounding a tumor — even short-lived immune cells like neutrophils — can settle into stable, disease-driving states with clear links to how patients fare.
Deterministic reprogramming of neutrophils within tumors
This study shows that neutrophils, short-lived immune cells, enter tumors and undergo permanent rewiring of their genes and proteins, settling into a single terminal state that promotes blood vessel growth. These reprogrammed cells cluster in low-oxygen, sugar-hungry regions at the tumor core. The work recasts neutrophils from bystanders into active contributors to cancer progression, and a possible handle for therapy.
Science (2024) · 335 citations
Read the original → https://doi.org/10.1126/science.adf6493
Cancer-associated fibroblast phenotypes are associated with patient outcome in non-small cell lung cancer
Using a high-resolution tissue-imaging approach on more than 1,000 lung cancer patients, the authors catalogue 11 subtypes of fibroblast support cells and group them into 4 patterns that predict how long patients survive. One pattern, rich in 'tumor-like' fibroblasts, was strongly tied to poor prognosis. The work positions these support cells as independent risk factors and a plausible angle for personalized treatment.
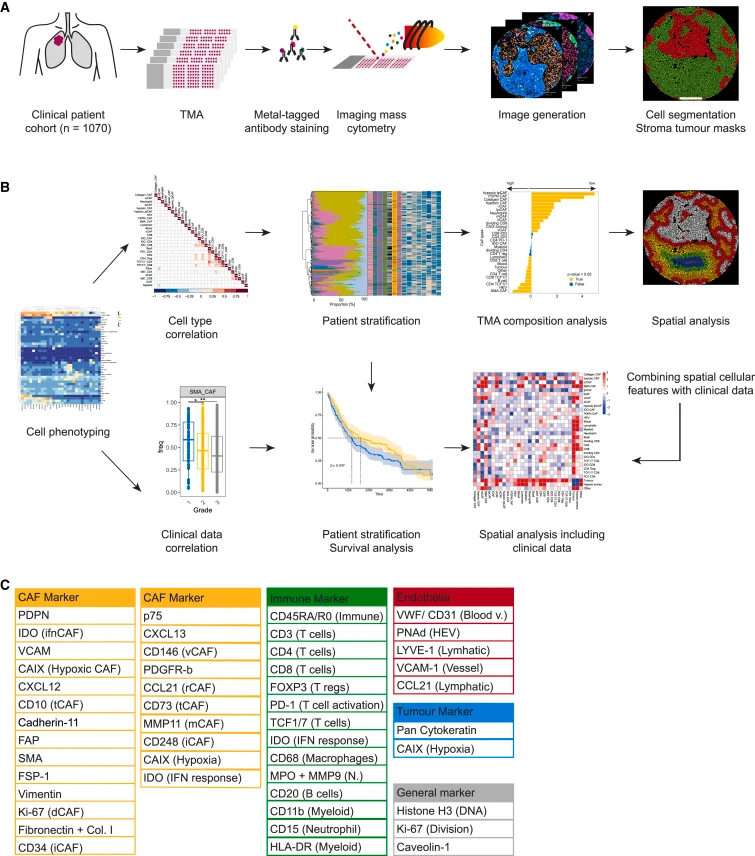
Figure 1 from L. Cords et al., Cancer Cell (2024). Licensed CC BY-NC-ND. Source: 10.1016/j.ccell.2023.12.021.
Cancer Cell (2024) · 264 citations
Read the original → https://doi.org/10.1016/j.ccell.2023.12.021
Inferring histology-associated gene expression gradients in spatial transcriptomic studies
The authors present Spatial Gradient Screening, a tool that scans spatial gene expression maps to find genes whose activity smoothly tracks with features visible in tissue histology, without forcing the data into pre-defined groups. They demonstrate it on injured mouse brain and brain tumor samples. The method helps researchers pick up subtle, location-driven gene patterns that traditional group-based approaches tend to miss.
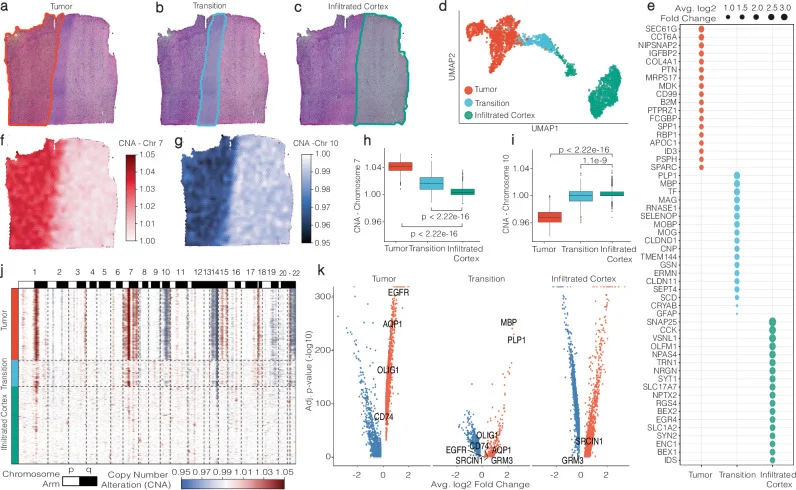
Fig. 1 from J. Kueckelhaus et al., Nature Communications (2024). Licensed CC BY. Source: 10.1038/s41467-024-50904-x.
Nature Communications (2024) · 74 citations
Read the original → https://doi.org/10.1038/s41467-024-50904-x
A comprehensive benchmarking with practical guidelines for cellular deconvolution of spatial transcriptomics
This benchmark study systematically compares 18 computational methods for estimating which cell types are mixed inside each spot of a spatial transcriptomics experiment, across 50 real and simulated datasets. It evaluates accuracy, robustness, and ease of use, and produces practical guidelines for choosing a tool. A handy reference for anyone planning a spatial transcriptomics project.
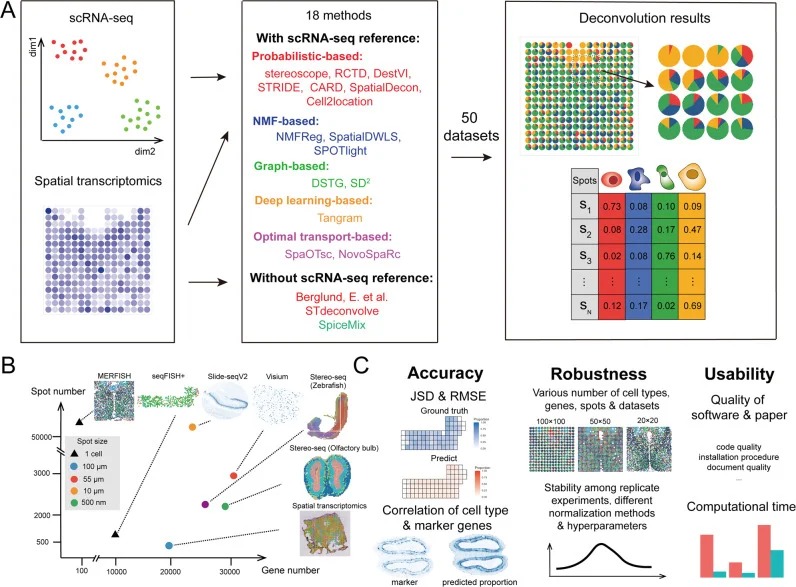
Fig. 1 from Haoyang Li et al., Nature Communications (2023). Licensed CC BY. Source: 10.1038/s41467-023-37168-7.
Nature Communications (2023) · 235 citations
Read the original → https://doi.org/10.1038/s41467-023-37168-7
Transformer for one stop interpretable cell type annotation
TOSICA is a deep learning model based on the Transformer architecture that automatically transfers cell-type labels from a labeled reference dataset to a new single-cell dataset, using biologically meaningful inputs such as gene pathways instead of raw gene lists. It is fast, accurate, and its attention weights reveal which pathways drive each label. That makes large-scale cell annotation both reproducible and more interpretable than many existing tools.
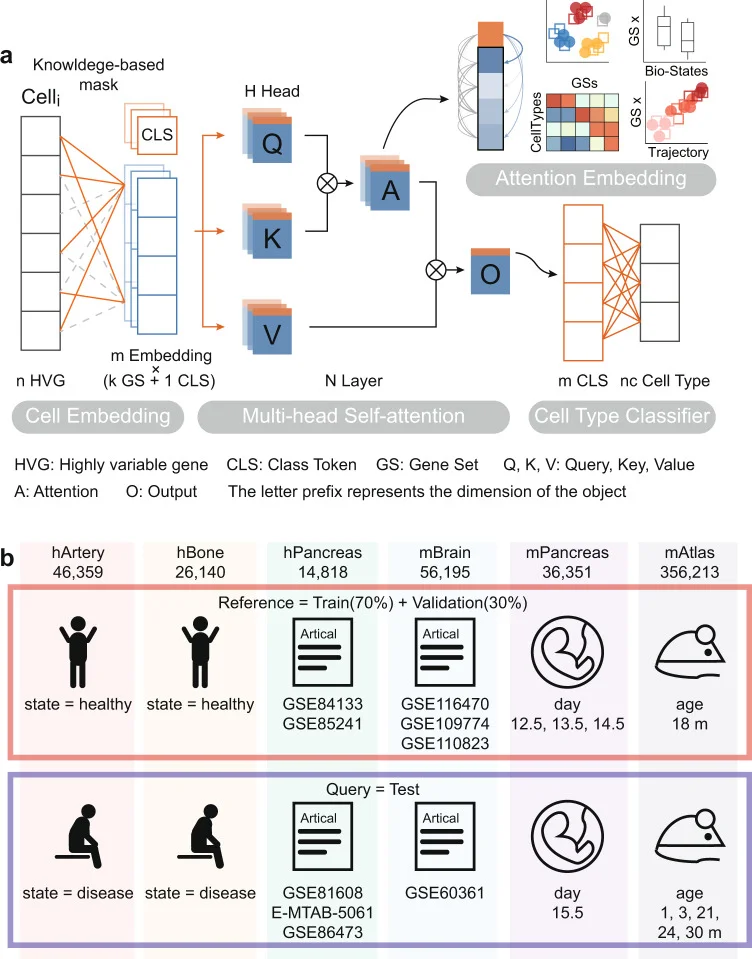
Fig. 1 from Jiawei Chen et al., Nature Communications (2023). Licensed CC BY. Source: 10.1038/s41467-023-35923-4.
Nature Communications (2023) · 202 citations
Read the original → https://doi.org/10.1038/s41467-023-35923-4
Explainable multi-task learning for multi-modality biological data analysis
UnitedNet is a neural network framework that jointly performs multiple analytical tasks on single cells measured with several molecular layers at once, such as RNA levels, DNA accessibility, and protein abundance. It integrates these layers and also explains the gene-regulatory links between them in a cell-type-specific way. The aim is to give biologists a single, interpretable model for understanding how different molecular programs interact inside the same cell.
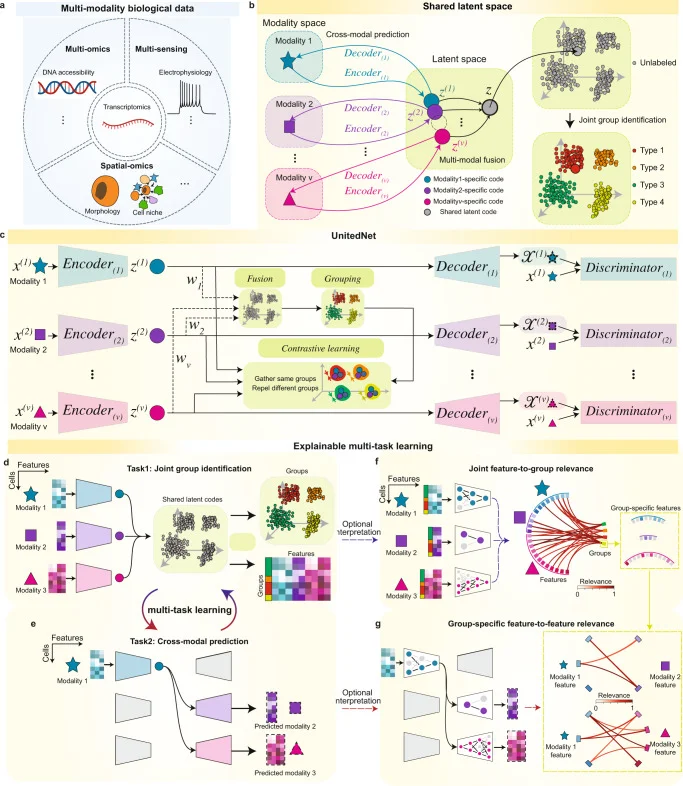
Fig. 1 from Xin-Hui Tang et al., Nature Communications (2023). Licensed CC BY. Source: 10.1038/s41467-023-37477-x.
Nature Communications (2023) · 107 citations
Read the original → https://doi.org/10.1038/s41467-023-37477-x
Quick links
| Paper | Venue / Year | Link |
|---|---|---|
| Deterministic reprogramming of neutrophils within tumors | Science (2024) | Read → |
| Cancer-associated fibroblast phenotypes are associated with patient outcome in non-small cell lung cancer | Cancer Cell (2024) | Read → |
| Inferring histology-associated gene expression gradients in spatial transcriptomic studies | Nature Communications (2024) | Read → |
| A comprehensive benchmarking with practical guidelines for cellular deconvolution of spatial transcriptomics | Nature Communications (2023) | Read → |
| Transformer for one stop interpretable cell type annotation | Nature Communications (2023) | Read → |
| Explainable multi-task learning for multi-modality biological data analysis | Nature Communications (2023) | Read → |