Statistical Self-Help Guide 2: The Deceptive Error Bar
Hello, fellow researchers on the front lines of science!
Every time you read a paper, do those little "whiskers" bobbing up and down on bar charts leave you a little confused? Sometimes they overlap, sometimes they don't, as if whispering secrets about the data. Those "whiskers" are today's subject — error bars.
You might think: "That's just showing the range of variability, right? Simple enough." Hold on — before you reach that conclusion, consider this sobering fact.
The Question That Left 78% of Researchers Stumped
Nature Methods once posed the following question to a group of researchers:
"How far apart do error bars for two groups need to be before the difference is statistically significant (e.g., P = 0.05)?"
The result was striking: only 22% of respondents gave an answer within a factor of two of the correct answer.
This means that the vast majority of us — people who look at and even draw error bars every day — may have been misinterpreting them all along. This misunderstanding is not merely embarrassing; it can lead to genuinely wrong scientific conclusions.
Three Plots That Look Identical but Have Wildly Different P-Values
Take a look at the three comparisons below. All three have error bars of the same length, and in each case the bars just barely touch. Would you guess their statistical significance is roughly the same?
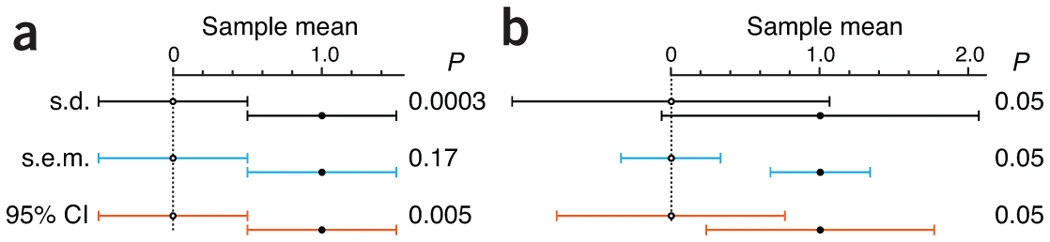
Figure 1: When s.d., s.e.m., and 95% CI error bars are all drawn at the same length and just touching, the underlying statistical meaning is entirely different.
The truth is:
- If these are s.d. (standard deviation) error bars, P ≈ 0.0003 (highly significant)
- If these are s.e.m. (standard error of the mean) error bars, P ≈ 0.17 (not significant)
- If these are 95% CI (confidence interval) error bars, P ≈ 0.005 (significant)
Mind-bending, right? This is the crux of the problem: an error bar without a stated type is a deceptive error bar!
So what exactly are the differences between these three types?
The Three Faces of Error Bars
Let's unmask them one by one.
1. Standard Deviation (s.d.)
- In a nutshell: The "spread indicator" of your data distribution.
- The question it answers: "How dispersed are my data? If I draw one more data point from the same population, where might it fall?"
- Key property: s.d. reflects the intrinsic variability of the data. As long as samples come from the same population, s.d. converges to a stable value regardless of how much you increase your sample size n.
- When to use it: When you want to display the raw variability of your data, or when you want to highlight differences in spread between groups (e.g., one group is tightly clustered, another is widely dispersed).
2. Standard Error of the Mean (s.e.m.)
- In a nutshell: The "precision ruler" for your sample mean.
- The question it answers: "How confident am I in my estimate of the mean? If I repeated this experiment N times, how far would the new means scatter around the current one?"
- Key property: s.e.m. reflects the uncertainty of the sample mean; it shrinks as sample size n increases. The formula is s.e.m. = s.d. / √n. The larger the sample, the more precise the mean estimate, and the smaller the s.e.m.
- When to use it: One of the most common error bar types in biological papers, used when comparing group means.
3. 95% Confidence Interval (95% CI)
- In a nutshell: A "fishing net" for the true population value.
- The question it answers: "I've cast a net using my sample data, and I'm 95% confident that this net has captured the true population mean — the real value we can never measure directly."
- Key property: A 95% CI provides a trustworthy interval estimate. In repeated experiments, 95% of the calculated CI intervals will contain the true population mean. It is more intuitive than s.e.m. and is especially popular in clinical and medical research.
- When to use it: When you want to provide an interval estimate for a population parameter (such as the mean) at a specified confidence level.
As sample size n increases, both s.e.m. and 95% CI narrow — reflecting increasing precision. The s.d., by contrast, remains stable.
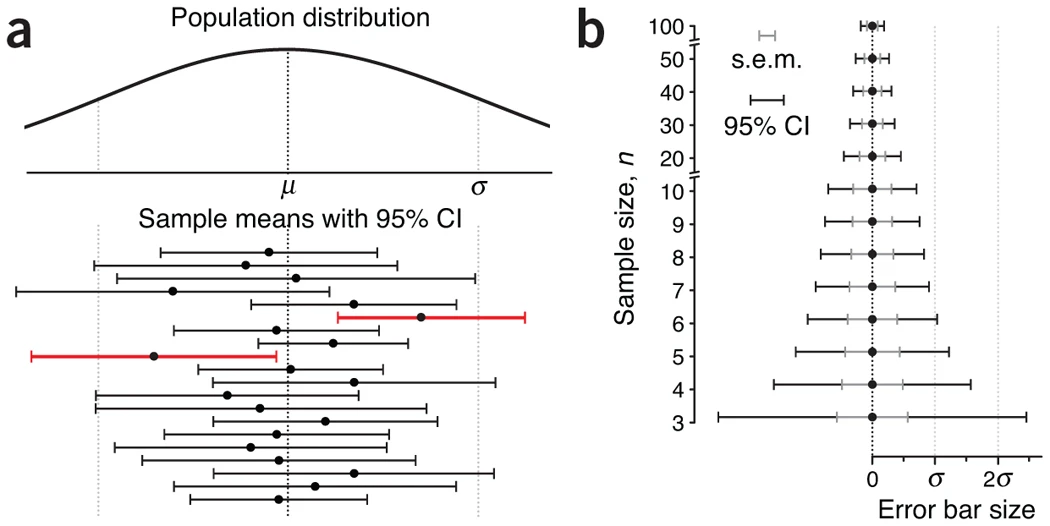
Figure 2: As sample size increases, s.e.m. and 95% CI error bars become narrower.
Busting the Biggest Myth: Overlap ≠ Not Significant!
This is the most widespread — and most dangerous — misconception about error bars. Burn the following into your memory:
Wrong: "Non-overlapping error bars = statistically significant difference"
Also wrong: "Overlapping error bars = no statistically significant difference"
The relationship between overlap and significance depends entirely on the type of error bar.
Let's reinforce this with some concrete facts:
- When two s.e.m. error bars just touch, P ≈ 0.17 — far from the conventional significance threshold of 0.05!
- For P ≈ 0.05 with s.e.m. bars, you need a gap between the bars of roughly half the arm length of one s.e.m. bar.
And now for the more counterintuitive 95% CI case:
- When two 95% CI error bars just touch, P ≈ 0.005 — meaning the difference is highly significant!
- Two 95% CI bars can even overlap by 25% of their arm length (i.e., 50% of the total bar length), and the difference is still significant at P ≈ 0.05!
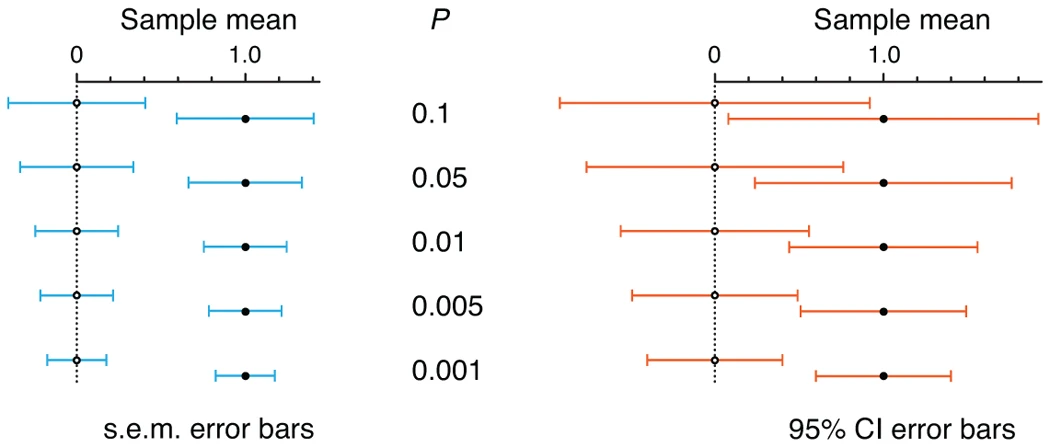
Figure 3: Relative positions of s.e.m. and 95% CI error bars at different P-values. Note the P = 0.05 row: s.e.m. bars must be separated, while 95% CI bars overlap.
Practical Guide: How Do I Choose and Interpret Error Bars?
1. Three questions to ask before plotting
Question 1: Do I want to show how spread out my data are?
- Yes, I want to convey the raw variability of individual observations. → Choose s.d.
Question 2: Do I want to compare means between groups and reflect the precision of those means?
- Yes, that's my primary goal. → Choose s.e.m. (biological convention) or 95% CI (more intuitive; recommended).
Question 3: Do I want to give readers a credible range for the true population mean?
- Yes, I want readers to have a clear sense of where the true value likely lies. → Choose 95% CI.
2. Quick conversion: two handy approximations
In many situations, you can quickly estimate the width of a 95% CI from the s.e.m.:
- For small samples (n = 3): 95% CI ≈ 4 × s.e.m.
- For large samples (n > 15): 95% CI ≈ 2 × s.e.m.
3. Watch out for small sample sizes!
When n is very small (e.g., n = 3), any error bar is highly unstable and can easily mislead. In these situations, the best practice is to show all individual data points (e.g., as a dot plot or strip chart) rather than summarizing with a mean and error bar alone.
Let Your Data Tell the Truth
Error bars are not mere decorations on a chart. They carry critical statistical information and serve as a key window into the reliability of your data.
The next time you read or draw an error bar, remember three things:
- Check the legend first: Is it s.d., s.e.m., or CI? This single piece of information completely changes how you interpret the figure.
- Always label clearly: In your own figures, explicitly state the type of error bar and the sample size n.
- Don't judge by overlap alone: Stop using "do the bars overlap?" as a quick proxy for statistical significance.
Good scientific visualization is not about making figures look polished — it's about making data honest.
A tip for responding to reviewers: If a reviewer challenges you with "your 95% CI error bars overlap — how can you claim the difference is significant?"
You can now confidently cite the Nature Methods paper and walk them through the statistical reasoning with ease.
Reference: Krzywinski, M., & Altman, N. (2013). Error bars. Nature Methods, 10(10), 921–922.
You're welcome to join the Bioinfo Study Room community group. If the QR code has expired, you can add the editor on WeChat (ID: mianapop) to be added to the group.

Originally posted on WeChat Official Account: bioinfo_studyroom